Coy: United Bank For Africa Plc
Rating: Buy
Current Market Price:N8.25
Year High: N13.50
Year Low: N7.00
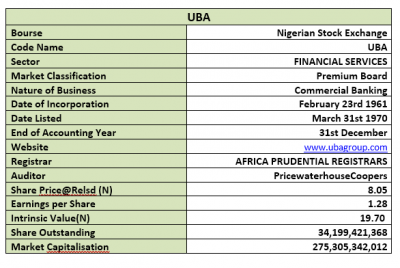
Fair Value: N19.70
Expected Q3-EPS: N1.90
By: Jeariogbe Tunde Segun (Equity Analyst)
Introduction
• This report reviews the half-year financial performance of United Bank for Africa (UBA).
• But valuation was achieved through full year performances, from where projections were made and appropriate techniques adopted.
• We maintained that analyst influence might be reflected in the valuation and projections accordingly.
• The next financial statistics currently awaited by investors from the financial institution is the nine-month performance indices.
• History reveals that the bank usually releases its third quarter earnings in the second week of October. For example, released dates for the past three financial years are: October 16, 11, and 15 in 2017, 2016 and 2015 respectively.
• Standing upon this fact, we expect same between October 8 and 19, 2018
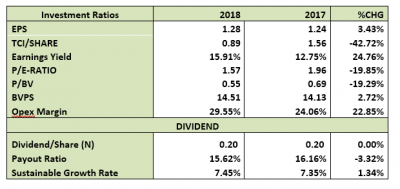
• Please note that interim cash dividend trend had remained same (N0.20 per share) for the past three years, although slight variations were noticed in the payout ratio. We are of the opinion that such variations are negligible.

Company Figures
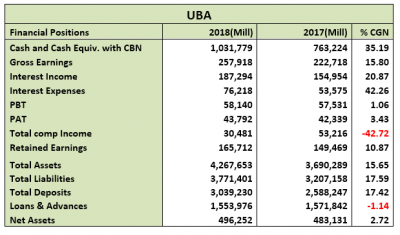
• Gross Earnings for the half year improved over the corresponding year by 15.80%, from N222.71 billion to N257.91 billion.
• Interest Income stood above that of similar period of 2017 by 20.87%; standing at N187.29 billion, as against the previous N154.95 billion.
• Interest Expenses increased at a higher momentum, compared to the rate of income/ gross earnings growth, rising from N53.57 billion to N76.21 billion, representing a difference of 42.26%
• Having considered all expenses and incomes, N58.14 billion was reported as Profit before Tax for the period, which is only 1.06% above the N57.53 billion reported in the same period of 2017
• After deducting income tax expense, the financial institution reported N43.79 billion as profit for the period as against the N42.33 billion earned in 2017 half-year. In other words, the profit only improved by 3.43%.
• Total Comprehensive Income for the period stood 42.72% below what was reported in 2017 half year financial activities. A total of N30.48 billion was reported, compared to N53.21 billion.
• Retained Earnings grew to N165.71 billion from N149.46 billion, a 10.87% improvement within the two periods under comparison.
• Total Assets was valued at N4.26 trillion after enjoying 15.65% improvement over the period.
• Total Liabilities was estimated at N3.77 trillion, as against N3.20 trill in 2017.
• Total Deposits received for the period stood at N3.03 trillion, compared to the N2.58 trillion in the corresponding half-year of 2017, a difference of 17.42%.
• Meanwhile, Loan and Advances to customers dropped marginally against the previous half-year’s figure. According to the released document, Loan and Advances is currently N1.55 trillion, as against N1.57 trillion last year.
• Net Assets, on the other hand improved by a marginal 2.72% in the period under consideration in this report.

Volatility Ratios
• Estimated beta value of UBA Plc stood above both the market and industry’s Average Beta Value. This confirmed the volatility/patronage of its shares on the floor of the exchange
• Although, this is almost irrelevant, since we analyze a financial institution whose major business is to collect deposits (mostly reported under liability). We estimate Debt to Equity ratio as 104.21%, well above the 58.79% industry average.

Profitability Ratios
• Interest Expense to Gross Earnings is presently estimated at 29.55%, which is 22.85% above the 24.06% estimated in the 2017 half-year result.
• PBT Margin stood at 22.54%, as against 25.83% last year, representing a 12.73% drop.
• Similarly, Profit margin dropped against prior year’s. We have estimated 16.98% margin from Gross Earnings, compared to the 19.01% previous estimate.
• Return on Average Equity is now 8.82%, compared to the 8.76% returns achieved in the first six months of 2017.
• Return on Average Assets differs by 10.56%, moving from 1.15% to 1.03%.

Efficiency Ratio
• Gross Earnings to Total Assets was flat within the two periods compared.
• Gross Earnings to Equity is now 51.97%, as against the 46.10% estimated in the 2017 half-year financial statistics
• Financial Leverage is 8.60x as against 7.64x. This is an estimate of the number of times the total assets replicates the equity, meaning that the ratio got better over the review period.
• It was also established that 51.13% of the Total Deposit was given out as Loan and Advances during the period, 15.81% lower than the 60.73% during the first six months of 2017.
• Meanwhile, Loan and Advances is 36.41% of the Total Assets, 14.51% lower than the 42.59% of last half year. This shows a controlled/reduced risk compared to 2017.

Investment Ratios
• Just as in the company’s report above, since shares outstanding remained constant during the two periods under consideration, the estimated amount earned per units of UBA shares is N1.28, which is 3.43% above the N1.24 earned last year.
• P/E Ratio for the period is 1.57x, as against 1.96x estimated last year.
• As we speak, the Book Value of UBA Plc is N14.51 per share, fairly same as N14.13 last year. This confirmed that the company is currently undervalued.
• Also confirming this fact is the Price to Book Value that is estimated below unity, proving the low price against the Book Value.
• Operating Expenses for the period is currently 29.55%, this is 22.85% above the 24.06% of 2017 half year financials.

Valuation
As noted above, our valuation explored few full years’ financials prior, projected appropriately based on our growth expectations. Thus, we have placed the price of each UBA share at N19.70. Please note that our conservative earnings expectation for the expected nine months ended September 30th, 2018 is N1.90. This is about 6.74% growth above the previous third quarter earnings (N1.78) and 48.43% improvement from the half year earnings.


