
The Nigerian Exchange experienced a strong recovery across key sectors after a strong pullback. During this period, investors could invest in top sectors for better returns. This article offers an overview of how the market performed this week ending 10th of July, 2026
NGX ASI: Nigeria’s All-Share Index
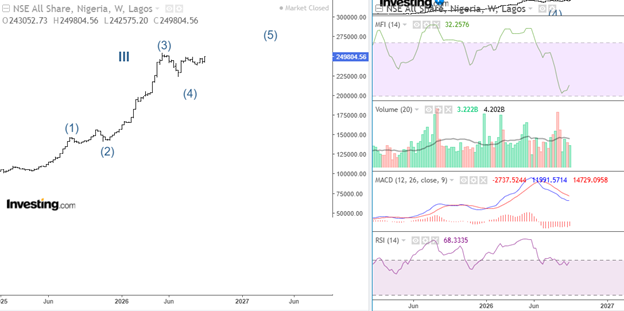
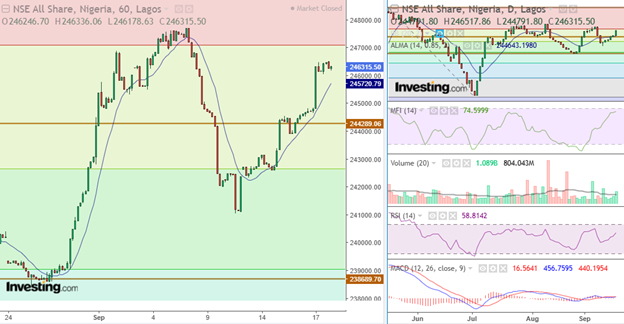
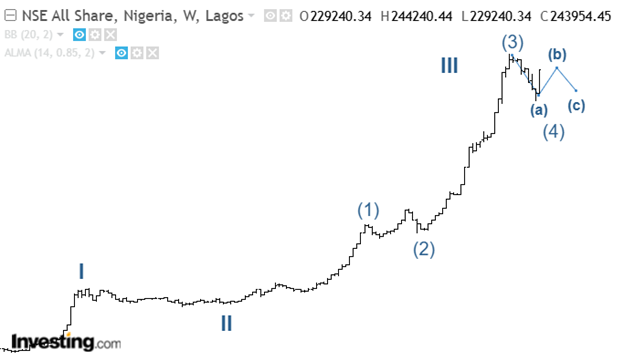
The NGX ASI gained 6.42%, closing at 243,954.45 basis points. This performance suggested that the market has commenced its recovery phase. This performance should prompt investors to position in defensive sectors for a better return on investment
Weekly chart indicator analysis for NGX ASI
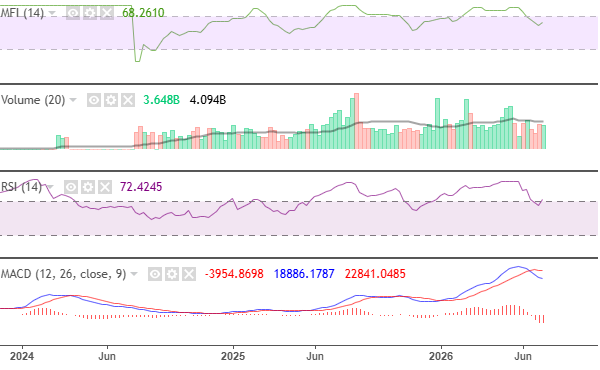
Index liquidity and momentum remained strong, with bullish volume and MACD’s signal closing solidly. Thus, a continuous bullish market should prepare these indicators for an overall aligned sentiment
Key Sectoral Index Performance for this Week
NGXBNK: Banking Sector Index
On the weekly chart, the banking sector index gained 4.78% and closed at 2,149.14 bps. The sector experienced a strong bullish sentiment, as investors bought into value. This performance creates investment opportunities for traders amid a corrective market.
Weekly chart indicator analysis for NGXBNK
Although MACD’s bearish momentum remained solid, the market remained strongly bullish. The market volume closed strongly above its moving average. In line with this performance, the market liquidity and momentum remained strong.
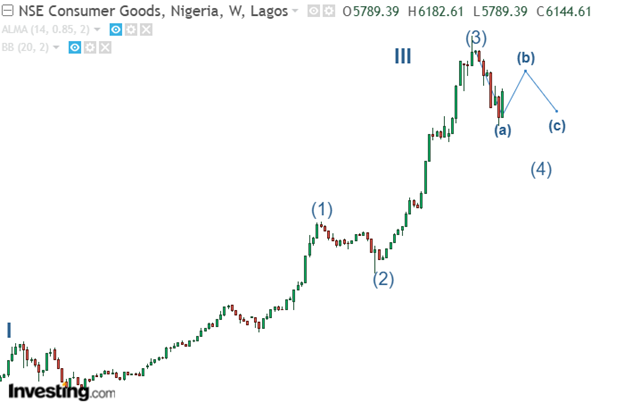
NGXCSMG: Consumer Goods Sector Index
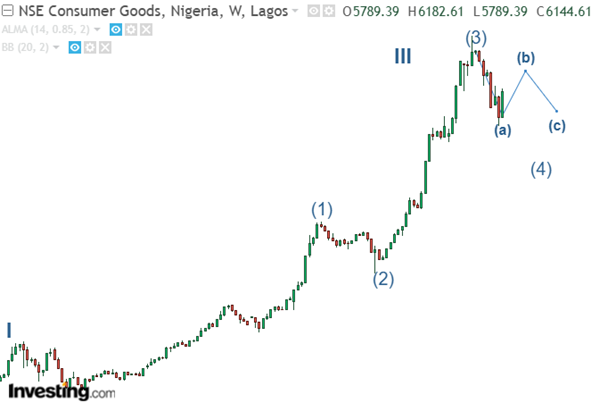
The consumer goods index gained 6.14%, closing at 6,144.61 bps. During the intra-week market, the index experienced strong bullish momentum, suggesting that the market is gradually recovering. This phase should benefit traders in the short run as the market remains within its recovery phase.
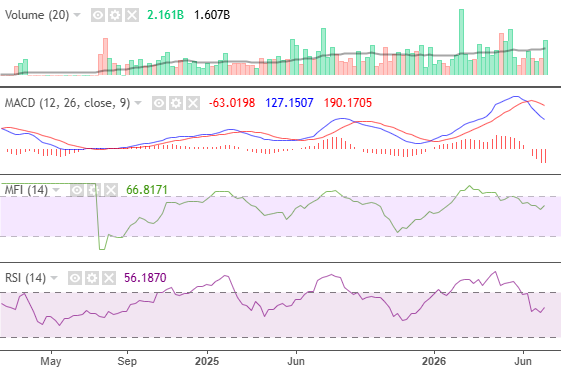
Weekly chart indicator analysis for NGXCSMG
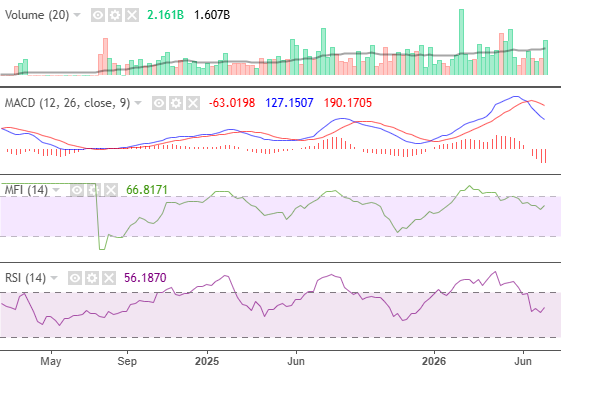
The bullish volume closed strong above its moving average, aligning with the strong bullish sentiment. In line with this performance, the market liquidity and momentum closed strongly above their threshold. This performance suggests that the index is strong and healthy.
NGXIND: Industrial Sector Index
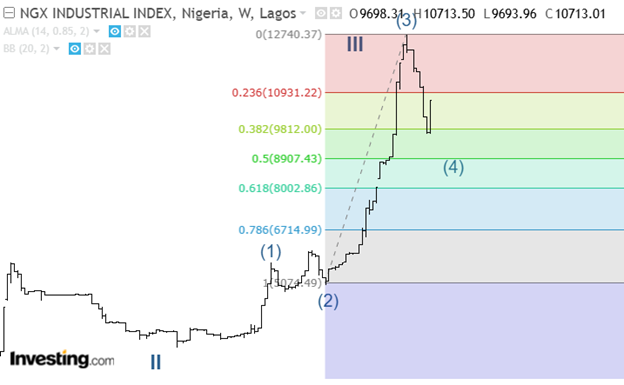
The industrial sector gained 10.46%, closing at 10,713.01 bps. On the weekly chart, the index experienced strong support at the 0.5 Fibbonaci level. This performance prompted investors to buy into value amid a corrective market.
Weekly chart indicator analysis for NGXIND
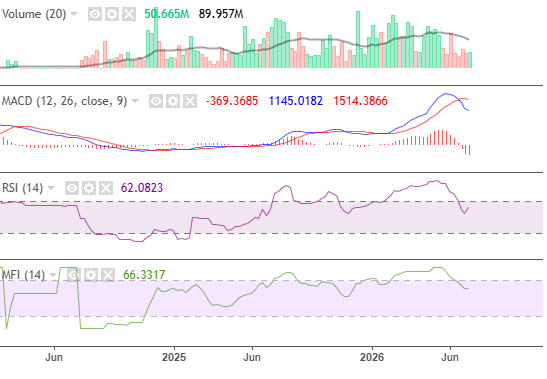
Despite the strong bullish moment, volume remained low. Also, MACD’s bearish signal closed strongly. However, the index’s liquidity and momentum sustained their strong bullish value, indicating a strong market.
NGXOGSE: Oil and Gas Sector Index
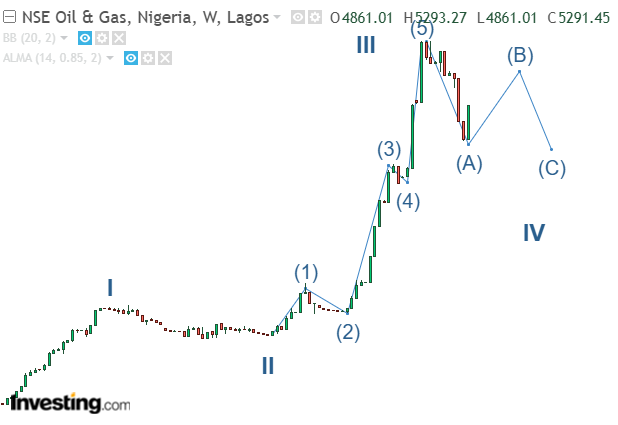
The oil and gas index gained 8.85% and closed at 5,291.45 bps. During the intraweek market, the index experienced a strong bullish sentiment, which suggests that the market is gradually recovering
Weekly chart indicator analysis for NGXOGSE
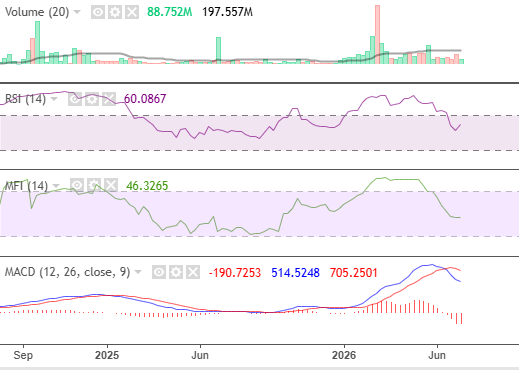
Despite the strong bullish volume, the market liquidity remained low, and MACD closed with a strong bearish sentiment. Thus, investors could watch for an increase in liquidity because it will determine the outlook of the sector.
NGXINS: Insurance Sector Index
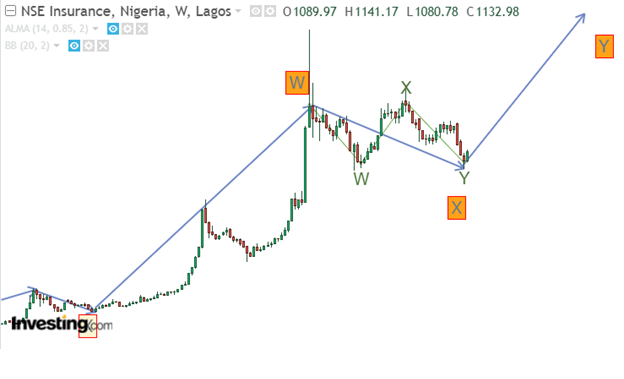
The insurance index gained 4.04%, closing at 1,132.98 bps. The sector started its recovery phase after a strong consolidating phase. Currently, the index has many strong resistance zones to surpass before emerging as a strong market
Weekly chart indicator analysis for NGXINS
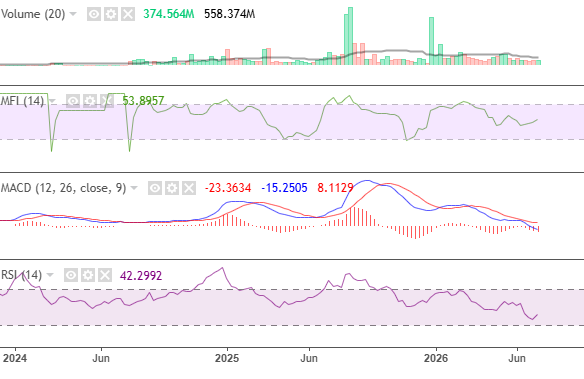
As the index recovers, money flow closed strongly above its threshold. This performance signifies renewed investor interest in the sector.