

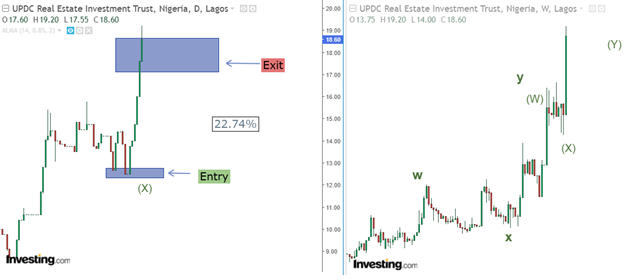
UPDCREIT has delivered on its first technical target, validating the bullish setup identified in the earlier analysis. From the reference price of N13.85, the first target of N17 represents a 22.74% gain.
Current price range: N18.60 to N19.20
Rating: Sell
Next price projection: N20 and N22
Technical Analysis
In this report, we shall use the following tools and analysis methods:
Elliott’s wave theory to understand the overall market sentiment
Fibonacci tools to determine support and resistance levels
The Relative Strength Index and volume to evaluate the market’s strength
The Money Flow Index to determine the market liquidity
Moving average and MACD to understand the nature of the trend
Top-down analysis to know the best investment position
Elliott wave analysis
Daily chart: Entry point
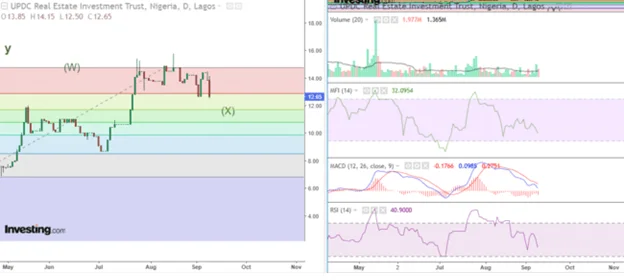
On September 9, 2026, UPDC Real Estate Investment Trust suggested that investors and traders watch for bullish momentum despite low liquidity, momentum, and volume. The following week, the stock commenced a strong bullish rally.
Daily chart: Exit point
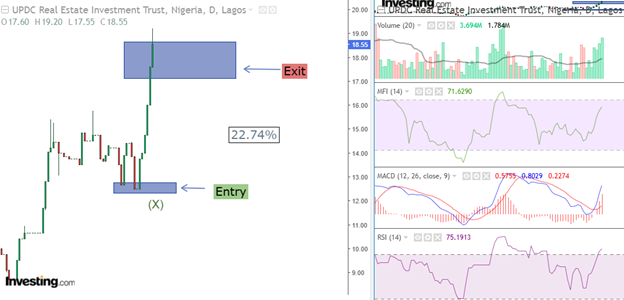
After retracing to the 0.382 Fibonacci level, UPDCREIT experienced strong bullish momentum, gaining 22.74%. This bullishness extended to N19.20 and met strong resistance. It also commenced Wave Y of the intermediate cycle.
In line with this performance, the stock’s momentum, volume, and liquidity improved exponentially. Thus, an investor who bought UPDCREIT with N500,000 at N13.85 would have made approximately N113,718 when the unit price reached the first target of N17, taking the investment to about N613,718
Next Buy-In Opportunity
While the stock looks impressive, investors and traders should expect a brief pullback to buy into value. After this pullback, the next price targets are N20 and N22. Traders and investors who bought between N13.85 and N12.50 can take profit and hold, as the stock has strong potential for a continuous bullish rally.