
Nigerian Stock Market Note For Month Ended August 31, 2026
Akintunde Oyedokun
The Nigerian Exchange (NGX) went through a significant shift in investor sentiment in the month of August, moving from the elevated levels reached during the market’s earlier rally into a period of aggressive profit-taking before buyers gradually returned towards the end of the month. The month therefore presented a combination of strong opening levels, a sharp mid-month correction, deteriorating breadth and renewed accumulation, leaving the market in a stronger position than it appeared to be midway through the month.
August was particularly important because it tested the durability of the NGX’s broader bullish trend. After delivering substantial gains earlier in the year, the market had reached levels where valuation concerns and profit-taking were increasingly likely to emerge. Investors responded by reducing exposure to several large-cap stocks, particularly in the banking, consumer goods and industrial segments. The resulting sell-off pushed the benchmark significantly lower and erased a meaningful portion of its earlier gains.
However, the correction did not develop into a full-scale breakdown. Instead, the market found support around the 239,000-point region, after which renewed demand emerged. The final sessions of the month were characterised by stronger buying interest, improved breadth and increased participation in major banking and oil and gas stocks. This helped the All-Share Index (ASI) recover most of the ground lost during the latter half of the month.
The month began with the NGX still benefiting from the positive momentum established during the previous months. The ASI advanced 0.18% on the first trading day to 245,730.53 points. The gain, however, was not accompanied by strong breadth, as decliners outnumbered gainers. This divergence provided an early indication that the market’s headline strength was not being matched by equally strong participation across listed equities.
Stocks such as ETERNA, VITAFOAM and FIRSTHOLDCO recorded notable gains, with FIRSTHOLDCO reaching a fresh 52-week high. The performance of selected stocks showed that investors were still willing to chase opportunities, but the uneven distribution of gains also suggested that market participants had become more selective.
The first week ended with the ASI at 245,573.60 points, representing a marginal 0.12% weekly gain. The small increase was not sufficient to confirm a strong continuation of the earlier rally, particularly as market breadth remained mixed. On the final trading day, 22 stocks advanced against 24 decliners, reinforcing the view that underlying participation was relatively weak.
Trading activity, however, remained substantial. Investors exchanged 5.359 billion shares valued at ₦139.053 billion in 261,869 deals during the week. Although volume increased by 4.69%, turnover value declined considerably compared with the previous week. This divergence between volume and value suggested that trading was increasingly concentrated in relatively low-priced stocks and that the increase in share count did not necessarily translate into stronger monetary participation.
Financial Services remained the most active sector, accounting for 3.469 billion shares valued at ₦73.013 billion, representing 64.73% of total equity volume. The Oil & Gas sector followed with 1.023 billion shares worth ₦18.90 billion, while ICT contributed 232.37 million shares valued at ₦14.62 billion.
The concentration of trading was also evident at the individual-stock level. Japaul Gold & Ventures, Fortis Global Insurance and FCMB Group collectively accounted for 47.80% of total equity volume. While this activity supported overall liquidity, it also highlighted the limited breadth of market participation.
The tone changed materially during the second week. The ASI initially climbed 1.20% on Monday to 248,529.75 points, marking the highest level recorded during the month. The move suggested that the bullish momentum was still intact and that the market could potentially challenge new highs. Instead, the advance triggered renewed profit-taking as investors used the elevated levels to lock in gains.
Selling pressure quickly spread across several heavyweight stocks, causing the index to retreat throughout the remainder of the week. By Friday, the ASI had fallen to 242,619.20 points, representing a 1.20% weekly decline.
Market capitalisation fell by 1.19% to ₦156.624 trillion, while the YTD return moderated to 55.91%. Although the decline was significant, the market remained substantially above its levels at the beginning of the year, illustrating the extent of the gains accumulated before the August correction.
The sell-off also became increasingly broad-based. MTNN, DANGSUGAR, TRANSCORP, BUAFOODS, UNILEVER, ACCESSCORP, ETI and NB were among the major stocks facing selling pressure. The deterioration in breadth became particularly clear on Thursday, when 41 stocks declined against only 17 gainers.
The rise in turnover during the sell-off provided another important signal. Rather than simply reflecting investors leaving the market, the higher volume indicated active repositioning as market participants adjusted portfolios, took profits and rotated into areas where valuations or technical conditions appeared more attractive.
A total of 12.153 billion shares valued at ₦176.058 billion were traded in 224,146 deals during the week. Compared with the previous week’s 5.359 billion shares and ₦139.053 billion turnover, both volume and value increased considerably.
Financial Services accounted for an extraordinary 92.25% of total equity volume, demonstrating the extent to which the sector influenced market liquidity. Fortis Global Insurance, Cornerstone Insurance and Consolidated Hallmark Holdings alone represented 78.07% of total equity turnover volume.
This concentration was significant because it showed that the market’s high activity did not necessarily represent broad-based institutional accumulation. Instead, a substantial portion of the liquidity was concentrated in a small group of insurance and financial stocks.
The correction became even more pronounced during the week ended August 21. The ASI declined in all five trading sessions, losing another 1.35% to close at 239,351.16 points. Market capitalisation declined 1.33% to ₦154.534 trillion, while the YTD return fell to 53.81%.
At this point, the market had experienced a substantial reversal from the month’s peak. The deterioration in sentiment was reflected in the number of stocks registering new 52-week lows, with NEM, FIDELITYBANK, ARADEL and DANGSUGAR among the names under pressure.
Market breadth remained particularly weak, with 28 stocks declining against just 14 gainers on Thursday. The persistence of negative breadth suggested that the correction was not limited to a handful of large-cap stocks but was affecting a wider portion of the market.
Despite the weakness in the benchmark, investors continued to trade actively. A total of 6.242 billion shares valued at ₦157.764 billion changed hands in 186,496 deals. Financial Services once again dominated, accounting for 89.62% of total equity volume.
Fortis Global Insurance, Lasaco Assurance and Consolidated Hallmark Holdings collectively accounted for 66.77% of total volume. The repeated dominance of these counters reinforced the market’s unusual concentration during the correction.
From an investment perspective, the combination of persistent losses, weak breadth and increased numbers of 52-week lows represented a clear deterioration in short-term sentiment. However, the decline was also creating the conditions for a technical rebound. As prices moved closer to established support levels, risk-reward conditions began to improve for investors willing to accumulate fundamentally stronger stocks at lower prices.
The market eventually responded to those conditions during the final full trading week of August. After suffering 11 consecutive sessions of losses, the NGX returned to positive territory as the ASI gained 0.81% to close at 241,298.47 points.
Market capitalisation increased 0.84% to ₦155.83 trillion, while investor sentiment improved as buyers returned to banking, oil and gas and selected value stocks.
The recovery was supported by an important market-development catalyst after FTSE Russell confirmed Nigeria’s transition from “Unclassified” to Frontier Market status. The reclassification improved the country’s standing within the global equity-market framework and provided a fresh narrative for investors who had been concerned about Nigeria’s market classification and international accessibility.
Although the announcement did not immediately eliminate the market’s underlying challenges, it provided an additional reason for investors to reconsider Nigerian equities after the significant correction.
The rebound initially remained cautious. The ASI still declined on Monday and Wednesday as investors continued to take profits in selected large-cap stocks. However, buying interest strengthened towards the end of the week, with banking stocks playing a major role in ending the prolonged losing streak.
By Friday, the ASI gained 0.90%, while market breadth improved substantially to 33 gainers against 19 losers. The improvement in breadth was important because it indicated that the recovery was beginning to extend beyond a few individual stocks.
Sector performance also turned more supportive. The Oil & Gas Index led the market with a 4.54% gain, while the Banking Index rose 2.89% and the Commodity Index gained 3.31%. The performance reflected renewed appetite for sectors with strong earnings potential and significant exposure to the domestic economic recovery.
Consumer Goods and Insurance remained comparatively weak, declining 0.67% and 0.63%, respectively. This divergence demonstrated that the market was undergoing sector rotation rather than experiencing an indiscriminate recovery across all segments.
University Press emerged as the strongest weekly performer, gaining 18.75%, while International Energy Insurance recorded the largest decline at 26.61%. Seplat Energy also provided significant support to the Oil & Gas segment with a 10% gain, although TotalEnergies declined by the same magnitude.
The final trading day of August provided the strongest evidence that sentiment had improved. The ASI surged 1.20%, equivalent to 2,901 points, to close at 244,199.39 points.
Market capitalisation rose to ₦156.83 trillion, while the YTD return improved to 56.93%. The advance was supported by stronger buying interest across banking, consumer, industrial and hospitality stocks.
Banking stocks were particularly influential, with ACCESSCORP, ETI, ZENITHBANK, FIDELITYBK, UBA and GTCO all closing higher. NB and PZ also contributed to the positive session, while selected hospitality and industrial counters recorded gains.
The broader participation was one of the most encouraging features of the final session. Unlike some earlier rallies that were heavily dependent on a limited number of heavyweight stocks, the August rebound showed evidence of wider participation.
ACCESSCORP led the market by volume, while MTNN recorded the highest traded value, followed by GTCO and ACCESSCORP. The combination of stronger price action, healthy turnover and improving breadth strengthened the case that the market was entering September with a more constructive technical structure.
Nevertheless, the recovery remains incomplete. The ASI has yet to decisively reclaim the levels around its August peak, and the market continues to face the risk of renewed profit-taking if investors fail to maintain buying momentum.
Market Liquidity and Investor Participation
Liquidity remained one of the defining themes of August. Trading activity increased sharply during periods of market weakness, demonstrating that investors were actively repositioning rather than abandoning the market.
The increase in turnover during the correction is particularly relevant because it suggests that sellers were met by willing buyers at lower prices. This is often an important characteristic of a healthy correction, provided that demand remains strong enough to absorb supply.
However, the concentration of trading within the Financial Services sector also represents a potential weakness. When a large percentage of total market volume is generated by a relatively small number of stocks, headline liquidity can overstate the actual depth and breadth of investor participation.
For the recovery to become more sustainable, market activity will need to broaden across banking, industrial, consumer goods, telecommunications, energy and other major segments.
Sector Rotation
Sector rotation was another major feature of August. Financial Services remained the dominant sector in terms of trading volume throughout much of the month, but price performance varied significantly across sectors.
Banking stocks came under pressure during the correction before becoming some of the most important drivers of the late-month rebound. The renewed demand for ACCESSCORP, ETI, ZENITHBANK, FIDELITYBK, UBA and GTCO was particularly significant because of the sector’s large weighting and influence on the ASI.
Oil & Gas stocks also regained investor attention during the recovery. The 4.54% gain in the sector index during the final full trading week reflected renewed demand for energy-related exposure, while Seplat Energy’s 10% gain provided substantial support.
Consumer Goods and Insurance, by contrast, remained weaker. Their underperformance suggested that investors were becoming more selective, favouring stocks and sectors with stronger catalysts or more attractive near-term valuations.
This rotation is likely to continue into September as investors assess earnings prospects, monetary policy, liquidity and the relative valuation of individual sectors.
Technical Analysis
From a technical perspective, August produced a clear correction-and-recovery pattern.
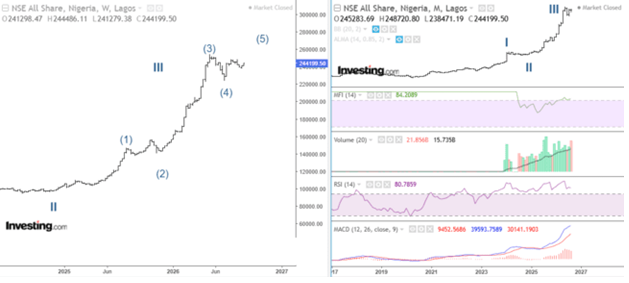
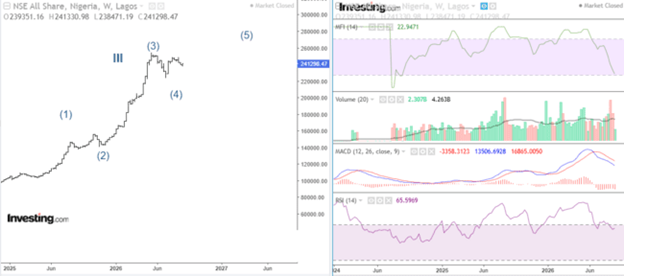
The ASI began the month around 245,000 points and initially pushed higher before reaching its monthly peak at 248,529.75 points. The failure to sustain that level triggered a sharp reversal, with the index eventually falling towards 239,000 points.
The decline into the 239,000–241,000 region is technically important because buyers emerged around those levels. The subsequent recovery towards 244,199.39 points suggests that the market has established an initial support structure.
The immediate resistance zone remains around 245,000–247,000 points. This area is likely to attract renewed selling pressure because investors who purchased at lower levels may use a return to these prices to take profits.
A decisive break above 247,000 points, particularly if accompanied by stronger volume and improving market breadth, would provide a stronger technical signal that the correction has ended. Such a move could bring the 248,500-point region back into focus and potentially create room for a retest of previous highs.
On the downside, the 241,000–242,000-point region represents the first important support zone. A sustained move below this area would weaken the recovery structure and could expose the ASI to another test of 239,000 points.
A break below 239,000 points would represent a more serious deterioration in the short-term technical outlook and could encourage another wave of profit-taking.
Market breadth will therefore be critical. A rising ASI supported by increasing numbers of advancing stocks would provide stronger confirmation of the recovery. Conversely, if the index rises while breadth deteriorates, the rally could prove vulnerable to another reversal.
September Outlook
The NGX enters September on a more constructive footing after recovering from the August correction, but investors should remain cautious as the market approaches the resistance levels created during the month’s earlier sell-off.
The immediate challenge is whether the ASI can regain and sustain levels above 245,000 points. A successful move through 245,000–247,000 points would strengthen market sentiment and potentially pave the way for a retest of 248,500 points.
If the index fails to break through that resistance, consolidation is likely to dominate trading as investors balance bargain hunting against continued profit-taking.
Banking stocks are expected to remain central to the market’s direction because of their significant weighting and continued investor interest. Oil & Gas stocks could also attract attention given the sector’s recent momentum and sensitivity to global crude-oil prices.
Investors are also likely to monitor corporate earnings expectations, interest-rate direction, domestic liquidity, foreign participation, naira movements and developments in the fixed-income market.
The macroeconomic environment presents both opportunities and risks. Nigeria’s headline inflation eased to 15.43% in July from 15.91% in June, suggesting continued moderation in price pressures. Meanwhile, the manufacturing sector recorded 3.3% year-on-year growth in Q1 2026, pointing to improving economic activity.
However, rising domestic debt-service costs remain a concern. Debt service increased 20.3% to ₦3.14 trillion in Q1, reinforcing concerns about fiscal pressures and the potential impact of government borrowing on domestic liquidity and interest rates.
The direction of monetary policy will therefore remain important for equities. Any improvement in liquidity conditions or expectations of lower interest rates could encourage rotation from fixed income into equities, while tighter financial conditions could continue to encourage investors to favour dividend-paying and fundamentally stronger companies.
Foreign investor participation will also be worth monitoring following Nigeria’s move from “Unclassified” to Frontier Market status under FTSE Russell. The reclassification improves the market’s formal positioning and could support greater international visibility over time, although the extent of actual foreign inflows will depend on accessibility, liquidity, currency considerations and investor risk appetite.
Overall, the August correction should be viewed more as a test of the market’s bullish structure than as a definitive reversal of the broader trend. The ASI remains significantly above its earlier-year levels, while the late-month rebound demonstrated that buyers are still willing to defend lower prices.
The key question for September is whether this renewed demand can develop into sustained accumulation. A breakout above 245,000–247,000 points with strong breadth and volume would strengthen the bullish case. Failure to clear that region, followed by a break below 241,000 points, would instead increase the probability of another period of consolidation or correction.
For investors, the environment therefore favours selectivity rather than indiscriminate buying. Stocks with strong earnings visibility, attractive valuations, sustainable dividends and clear catalysts are likely to remain better positioned as the market navigates the next phase of its cycle.
August Market Summary
The NGX ended August at 244,199.39 points after gaining 1.20% on the final trading session. Market capitalisation stood at ₦156.83 trillion, while 568.28 million shares valued at ₦36.50 billion were traded in 51,700 deals. The market’s YTD return stood at 56.93%.
HMCALL recorded the strongest gain for the month, advancing 37.46% to ₦4.00. ACCESSCORP rose 22.05% to ₦32.10, LINKASSURE gained 14.37% to ₦1.83, FIRSTHOLDCO appreciated 11.93% to ₦145.00, while TRANSCOHOT increased 9.76% to ₦265.50.
On the losing side, ZICHIS recorded the steepest decline, falling 40.73% to ₦14.55. THOMASWY declined 37.21% to ₦2.75, INTENEGINS dropped 32.05% to ₦2.82, CMFC shed 28.61% to ₦2.77, while CONHALLPLC declined 28.11% to ₦6.01.
August ultimately demonstrated both the strength and vulnerability of the NGX rally. The sharp correction showed that elevated valuations and accumulated gains could trigger aggressive profit-taking, while the late recovery demonstrated that underlying demand remains strong enough to absorb selling pressure.
As September begins, the market’s direction will depend largely on whether the late-August buying momentum can overcome the resistance created during the correction. For now, the technical structure remains cautiously constructive, with the 241,000–242,000 region providing near-term support and 245,000–247,000 representing the critical resistance band.
A sustained breakout above resistance would signal renewed bullish momentum, while a failure to hold support would raise the risk of another correction. The next phase of trading will therefore be defined by the balance between profit-taking, bargain hunting, sector rotation and fresh liquidity entering the market.
Global Market and Oil: Global financial markets ended August on a firmer footing, with major equity benchmarks posting monthly gains despite rising concerns over inflation, interest rates and renewed geopolitical tensions. Investor appetite for risk remained relatively strong through most of the month, supported by resilient corporate earnings and continued enthusiasm around artificial intelligence, although the final trading sessions showed that the rally remains vulnerable to higher oil prices and bond yields.
The month began with investors reassessing the outlook for global monetary policy following mixed economic signals from the United States. Expectations of easier monetary conditions provided an early boost to equities, while technology stocks remained the principal driver of gains. However, sentiment became increasingly fragile as the month progressed, particularly as oil prices strengthened and markets began pricing a higher probability of tighter U.S. monetary policy.
U.S. equities remained at the centre of the global rally. The S&P 500 gained 2.6% in August, while the Nasdaq Composite advanced 3.9%, giving technology stocks another month of outperformance. The Dow Jones Industrial Average rose 1.3%, extending its monthly winning streak to five months. Despite ending August lower on the final trading day, all three major indexes maintained positive monthly returns.
The Nasdaq’s stronger performance reflected continued demand for artificial intelligence and semiconductor-related stocks. Investors remained willing to pay premium valuations for companies positioned to benefit from rising AI investment, particularly as corporate earnings continued to provide evidence that technology spending remains strong.
However, the late-month performance exposed an important risk to the rally. A rise in U.S. Treasury yields, combined with higher crude prices, created renewed pressure on equity valuations. The 10-year Treasury yield climbed to about 4.75% at the end of August, its highest level since early 2025.
The bond market therefore became an increasingly important source of volatility. Investors entered August with expectations that monetary policy could become more supportive of growth, but those expectations were challenged toward the end of the month. A more hawkish tone from the Federal Reserve at Jackson Hole contributed to a reassessment of the interest-rate outlook, with markets moving to price a significantly higher probability of a September rate increase.
This shift was particularly significant for growth stocks. Technology companies generally carry higher valuations and longer-duration earnings expectations, making them more sensitive to increases in interest rates. The fact that the Nasdaq still gained almost 4% during the month demonstrates the strength of the underlying AI-driven investment theme, but it also highlights the potential for sharp corrections if yields continue to rise.
European equities also finished August in positive territory, although gains were more moderate than those recorded in the United States. The pan-European STOXX 600 gained approximately 0.7%, marking its fifth consecutive monthly advance.
The European market benefited from relatively resilient corporate earnings and continued expectations of economic stabilisation. However, the region remained exposed to higher energy costs and geopolitical developments. The late-month rise in oil prices therefore created an additional challenge for European investors, particularly given the region’s sensitivity to energy imports.
Asian markets presented a more mixed picture. Technology and semiconductor shares benefited from the global AI investment cycle, while emerging-market assets remained sensitive to movements in the U.S. dollar, Treasury yields and expectations for Federal Reserve policy. Investors continued to differentiate between economies based on domestic growth prospects, currency stability and exposure to global trade.
One of the strongest themes across emerging markets was renewed foreign investor interest in selected economies. India, for example, attracted about $3.1 billion in foreign portfolio investment during August, its strongest monthly inflow in almost two years.
The commodity market delivered some of the clearest signs of rising geopolitical risk. Crude oil prices accelerated toward the end of August as renewed U.S.-Iran military activity increased fears of supply disruption. Brent crude finished the month above $90 per barrel, while WTI settled around $86 per barrel.
The renewed increase in oil prices has important implications for the global economy. Higher crude prices can support energy companies and commodity-producing economies, but they also increase transportation and production costs and could slow the disinflation process. For central banks, this creates a difficult policy environment because an oil-driven inflation shock can occur even when economic growth is losing momentum.
Gold remained another major beneficiary of uncertainty. Investors continued to seek defensive assets amid concerns over geopolitics, monetary policy and the bond market. Gold’s strength during August reinforced its role as a hedge against both financial and geopolitical risk.
The U.S. dollar, meanwhile, remained under pressure for much of the month, although it recovered toward the end as expectations for higher U.S. interest rates strengthened. The direction of the dollar will remain particularly important for emerging markets because a stronger greenback generally tightens financial conditions, raises the cost of dollar-denominated debt and can encourage capital flows back into U.S. assets.
Market Drivers
The Federal Reserve remained the dominant macroeconomic driver. Investors repeatedly adjusted rate expectations in response to U.S. labour-market and inflation developments. The late-month hawkish shift increased the possibility that monetary policy could remain restrictive for longer than previously expected.
The second major driver was artificial intelligence. AI-related investment continued to support technology earnings and equity valuations, helping the Nasdaq outperform broader markets. The market’s ability to maintain momentum despite higher yields suggests that investors continue to place significant confidence in the long-term earnings potential of the technology sector.
The third driver was geopolitics. The escalation involving the United States and Iran pushed oil prices sharply higher during the final trading session and triggered simultaneous selling in stocks and bonds.
Technical Analysis and Outlook
From a technical perspective, the major U.S. equity indexes retained a bullish medium-term structure at the end of August. The S&P 500 remained near record territory, while the Nasdaq continued to outperform, confirming that technology remained the dominant source of market momentum.
However, momentum indicators are likely to become increasingly important in September. Rising Treasury yields and crude oil prices could create a negative divergence between equity prices and macroeconomic conditions. A sustained break below recent support levels would increase the probability of a deeper consolidation, particularly in highly valued technology stocks.
The broader market outlook remains cautiously bullish. The combination of strong corporate earnings, AI investment and resilient economic activity continues to provide support for equities. Nevertheless, the risk-reward balance is becoming less favourable as valuations remain elevated and the market faces a combination of higher oil prices, rising bond yields and potentially tighter monetary policy.
For September, investors are likely to focus heavily on the U.S. employment report, inflation data and Federal Reserve communication. A moderation in inflation and weaker labour-market conditions could revive expectations of monetary easing and support equities and bonds. Conversely, persistent inflation alongside elevated crude prices could push Treasury yields higher and increase pressure on global risk assets.
August therefore ended as a month of gains, but not complacency. Equities demonstrated considerable resilience, led by U.S. technology stocks, while gold and energy assets benefited from heightened uncertainty. The final trading session, however, provided a reminder that the global rally remains exposed to developments in oil, interest rates and geopolitics. The direction of these three factors will likely determine whether September extends August’s gains or marks the beginning of a broader market consolidation.