

Technical Analysis Tools
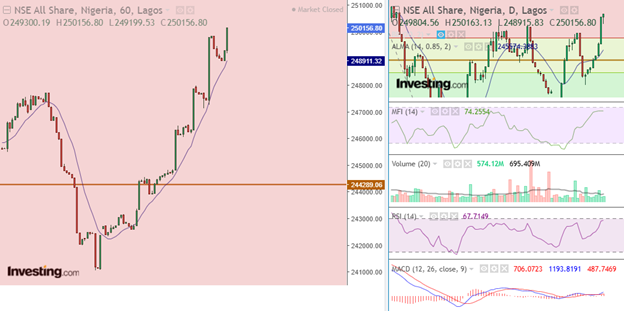
In this report, we shall use the following tools and analysis methods:
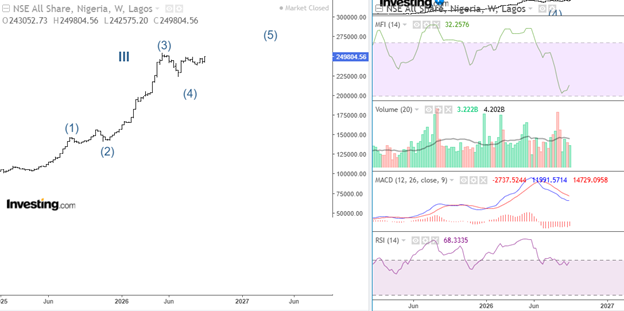
Elliott’s wave theory to understand the overall market sentiment
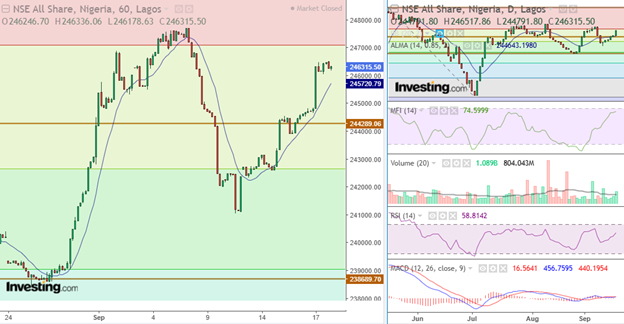
Fibonacci tools to determine support and resistance levels
The Relative Strength Index and volume to evaluate the market’s strength
The Money Flow Index to determine the market liquidity
Moving average and MACD to understand the nature of the trend
Top-down analysis to know the best investment position
UBA
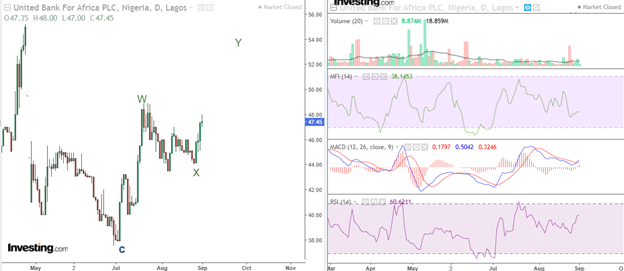
UBA just completed its corrective phase and commenced its impulsive phase Y of the minor degree. Given this sentiment, investors should watch for a continuous bullish rally and a short-term profit-taking zone at N53.
On July 23rd, 2026, UBA technical analysis suggested that investors should look for support levels at N45 and N46. In line with this sentiment, the long-term price projection for UBA remains N62 and N78
The company’s momentum and volume remain solid as MACD’s bullish signal strengthens. Thus, investors should observe MFI for increased liquidity to determine the stock’s overall outlook.
Zenith Bank
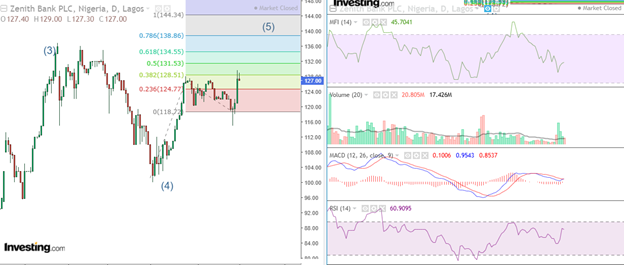
Zenith Bank completed its correction phase and started its bullish rally. Traders should watch N140 for short-term profit-taking. On July 27, 2026, Zenith Bank’s technical analysis suggested that investors should watch N190 as a possible support level, with long-term prices projected at N173.16 and N213.88.
Based on the indicator readings, Zenith Bank is recovering with strong bullish momentum. MACD commenced its bullish signal, and MFI’s momentum improved. Thus, investors should watch for continuous bullish momentum and increased liquidity.
GTCO
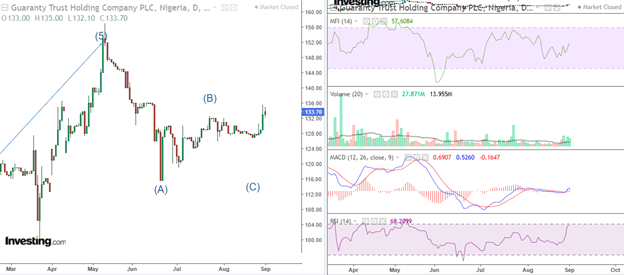
GTCO’s recovery phase is strong. Although GTCO’s technical analysis on July 22, 2026 suggested that investors should watch N125 as a potential support level, the stock sustained its recovery with the last lower high at N125.90. The price projection for GTCO remains N158 and N184
Based on the indicator readings, GTCO’s bullish recovery phase is strong. Volume, liquidity, and momentum remained solid. Thus, investors should watch for continuous bullish momentum.
PZ
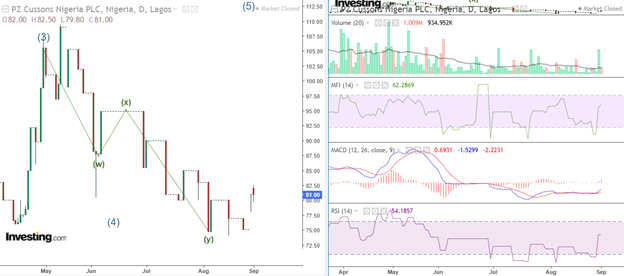
PZ completed its deep WXY correction on the daily chart and commenced its recovery phase. On July 8, 2026, PZ’s technical analysis suggested that investors should watch N80 as a potential support level, with N139.34 and N173.85 as resistance levels.
Currently, the stock recovery phase is strong and attracts investment opportunities. Volume remains solid as momentum and liquidity improve. Thus, investors should watch for continuous bullish momentum.
HBM (Lafarge Africa Plc)
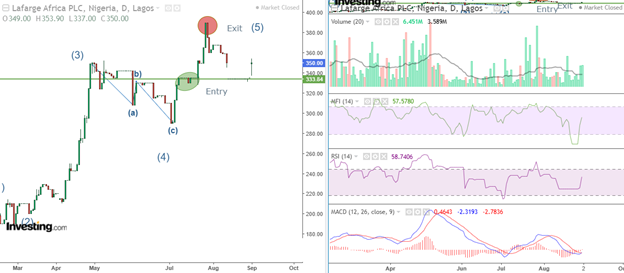
After HBM hit its first profit target at N380.56 on July 31, 2026, it retraced and met strong support at N333.84 for another bullish rally. Traders can target N380.56 and gain 13.59% or N437.29 and gain 21.44%
Currently, the stock’s volume, liquidity, and momentum remain strong. MACD commenced its bullish signal, making HBM attractive for investment. Also, the bullish volume remained solid, closing above its moving average. Investors should watch for a continuous bullish run.