

NPF Microfinance Bank Plc was incorporated on May 19 1993 as NPF Community Bank and commenced operations in August 1993. It subsequently became a public limited company and was listed on the Nigerian Exchange in December 2010.
Current price: N4
Rating: Buy
Price projection: N7 and N9
Technical Analysis
In this report, we shall use the following tools and analysis methods:
Elliott’s wave theory to understand the overall market sentiment
Fibonacci tools to determine support and resistance levels
The Relative Strength Index and volume to evaluate the market’s strength
The Money Flow Index to determine the market liquidity
Moving average and MACD to understand the nature of the trend
Top-down analysis to know the best investment position
Elliott wave analysis
Weekly chart: Market overview
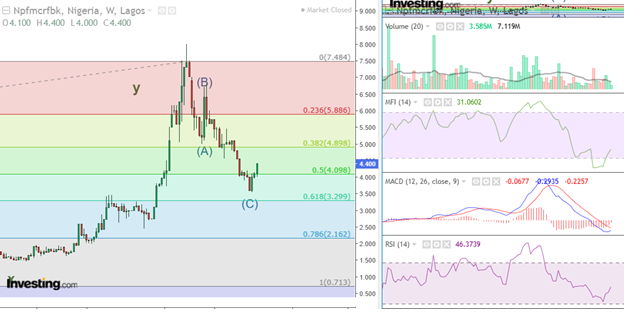
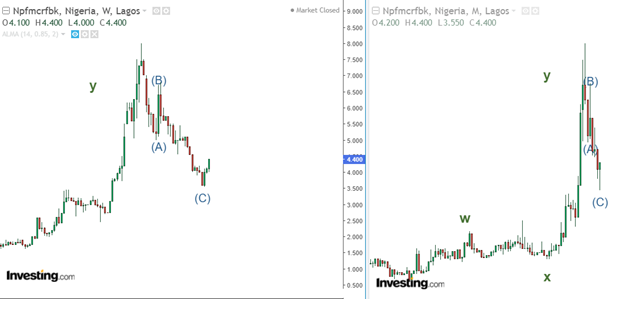
On the weekly chart, NPF completed its deep ABC correction and commenced its recovery phase within the 0.5 and 0.618 Fibonnaci levels. In line with this performance, the stock’s volume remained solid. Its momentum and liquidity also improved as the stock recovered. Notably, MACD sustained its divergence signal, preparing investors for a trend reversal.
Daily chart: Investment opportunity
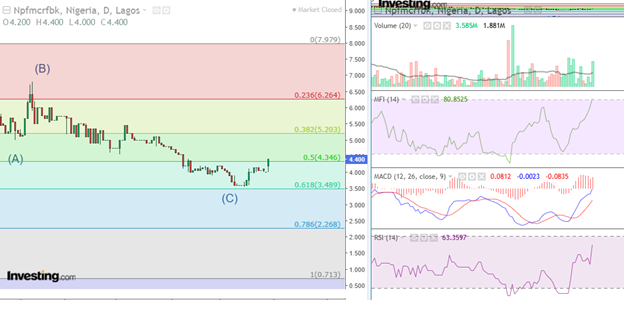
On the daily chart, NPFMCRFBK’s recovery remained strong. Its liquidity, volume, and momentum improved exponentially. Notably, MACD continued its bullish momentum after a sharp divergence. This performance signals sustained interest in the stock amid recovery. Thus, investors should watch N4 and N3.50 as potential support levels, with prices projected at N7 and N9.