

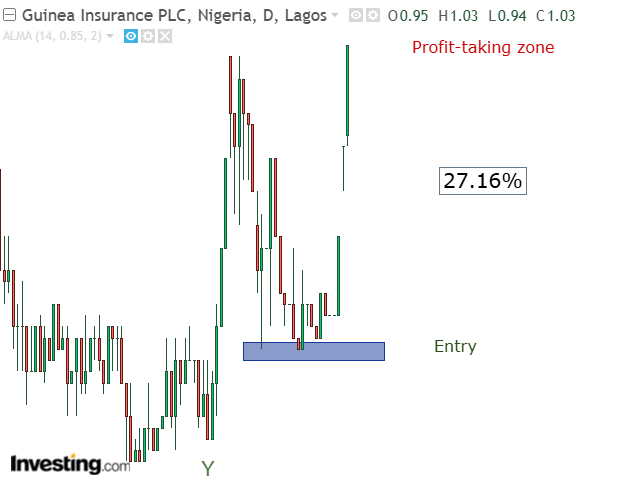
Current price range: ₦1.00 – ₦1.03
Rating: Sell
Next price projection: ₦1.60 and ₦2
Technical Analysis
In this report, we shall use the following tools and analysis methods:
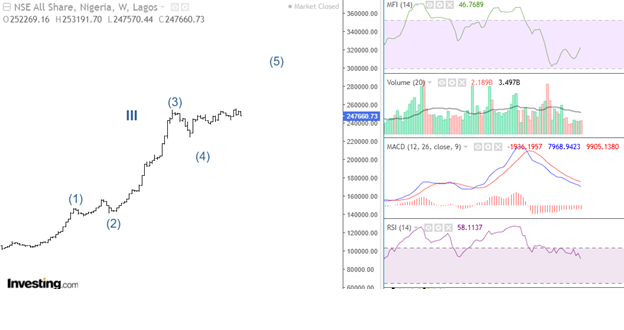
Elliott’s wave theory to understand the overall market sentiment
Fibonacci tools to determine support and resistance levels
The Relative Strength Index and volume to evaluate the market’s strength
The Money Flow Index to determine the market liquidity
Moving average and MACD to understand the nature of the trend
Top-down analysis to know the best investment position
Elliott wave analysis
Daily chart: Entry point
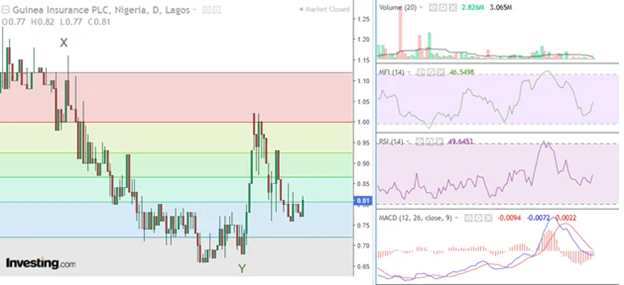
Investdata featured Guinea Insurance Plc in its stock to watch list on November 9, 2026. During this period, the insurance stock traded closed at ₦0.81, with improved volume, liquidity, and relative strength. Notably, MACD sustained its divergence signal, preparing for a trend reversal.
Daily chart: Profit-taking zone
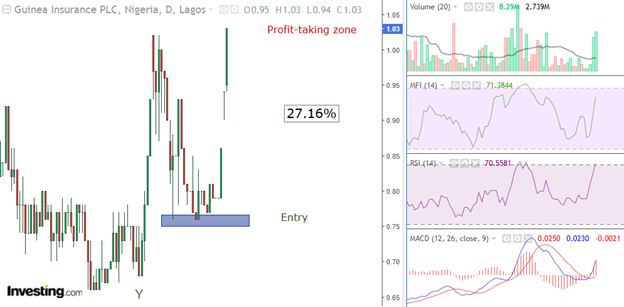
After one week, Guinea gained 27.16%, trading at ₦1.03. At this level, traders would be preparing to take profit amid emotional trading. In line with this performance, the stock’s liquidity, relative strength, and bullish volume improved exponentially. Also, MACD’s bullish momentum strengthened. This indication suggests that the stock has potential to continue its bullish momentum.
Next Buy-In Opportunity
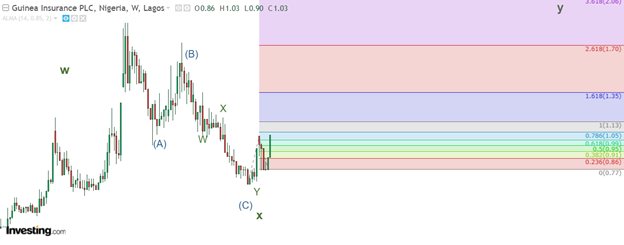
Following the strong bullish sentiment, traders should expect resistance between ₦1.10 and ₦1.20. In line with this sentiment, Guinea is expected to advance ₦1.60 and ₦2 in the long run.