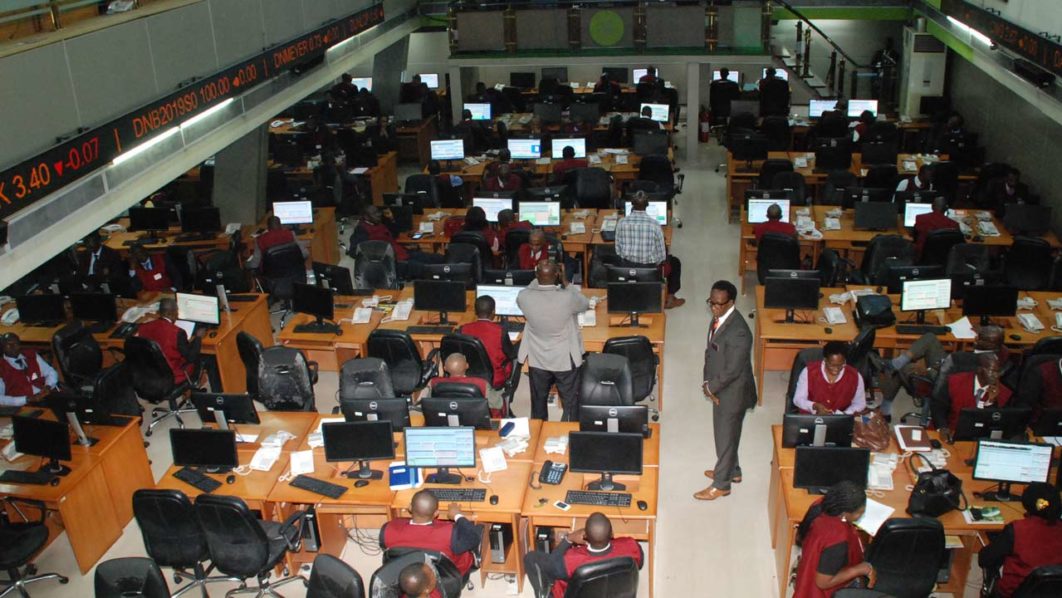


Caption: One of the biggest event on the Nigeria Exchange in the month was the September 14 flag-off of the N2.152 trillion Initial Public Offering (IPO) of the Dangote Petroleum Refinery involving the offer of 4.1 billion shares at N525 per unit. Pix shows Aliko Dangote promoter of DPR sounding the gong to declare trading open on the NGX after which there was a “Facts behind the offer” presentation.
Nigerian Stock Market Note- Month Ended September 30, 2026
Akintunde Oyedokun
The Nigerian equities market extended its bull-run in September, pushing the benchmark All-Share Index above the 252,000 basis point level, setting a fresh high before profit-taking emerged towards the end of the month.
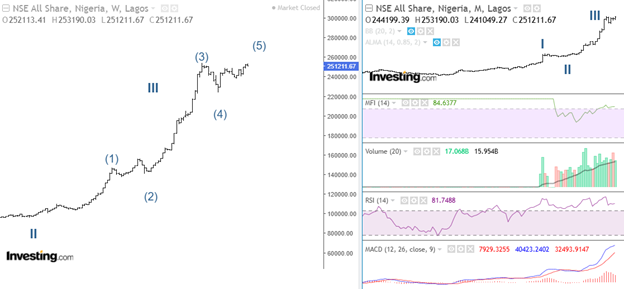
The market opened September from a strong position after closing August at 241,900.53 points. By the end of the month, the All-Share Index had risen to 251,211.67 points, representing a monthly gain of 3.85%. The performance further strengthened the market’s year-to-date return, pushing it to 61.43% at the end of September.
September was characterised by strong buying interests, intermittent corrections and renewed accumulation. The market moved through several phases during the month as investors responded to corporate developments, the monetary policy decision, liquidity conditions and the performance of major sectors.
The rally was particularly supported by financial services stocks, while selected consumer, industrial, oil and gas and services stocks also recorded significant movements. However, the strong gains accumulated earlier in the year encouraged profit-taking, particularly among investors with substantial positions in large-cap stocks.
The month’s performance also came against the backdrop of the Central Bank of Nigeria’s reduction of the Monetary Policy Rate to 23%, creating a new interest-rate environment for investors across equities and fixed-income securities.
Strong Start Sets the Tone
The NGX started September on a positive note, with the ASI gaining 1.20% on September 1 to close at 244,199.39 points. Market capitalisation increased by about ₦1.91 trillion, while market breadth stood at 43 gainers against 16 decliners.
The positive sentiment continued into the second trading session. On September 2, the index advanced another 0.77% to 246,082.63 points, lifting the year-to-date gain to 58.14%. FTN Cocoa led the gainers, while Tripple Gee recorded the largest decline.
The market subsequently paused on September 3, with the ASI slipping 0.03% to 246,019.17 points. Nascon Industries declined 10%, while Tripple Gee emerged among the strongest gainers.
Buying interest returned the following day as the ASI rose 0.15%. Seplat Petroleum gained 10%, while the Oil and Gas Index advanced 2.22%. The Banking Index, however, declined 0.27%, highlighting the uneven nature of sector performance during the opening part of the month.
The first week ended with another positive session. The ASI rose 0.25% on September 5 to 246,992.44 points, while market capitalisation increased by ₦405.67 billion. The year-to-date return consequently rose to 58.72%.
Trading activity was also significantly higher during the week. Investors exchanged about 4.36 billion shares valued at ₦210.33 billion in 223,284 deals, compared with 2.51 billion shares worth ₦123.22 billion in the previous week.
Financial services dominated market activity, accounting for about 3.58 billion shares, representing 82.10% of total volume. The sector also generated ₦88.64 billion in value. Fortis Global Insurance, UBA and Access Holdings jointly accounted for about 2.29 billion shares valued at ₦35.23 billion.
The strong concentration of trading in financial stocks reflected continued investor interest in the sector and its significant influence on overall market turnover.
Market Enters Correction Phase
The second week brought a major shift in sentiment as profit-taking intensified across several parts of the market.
The ASI initially gained 0.29% to 247,699.78 points on Monday, but the market subsequently came under heavy selling pressure. The index declined 1.17% in the following session and another 1.05% the next day, falling to 242,223.10 points.
The sell-off affected several large and mid-cap stocks. First HoldCo declined 9.30%, CAP Plc fell 7.73%, May & Baker lost 7.09%, while Access Holdings declined 7.06%.
Pressure extended beyond financial stocks. BUA Cement declined 10%, Cadbury Nigeria fell 9.94% and Nigerian Breweries lost 9.78%.
The magnitude of the selling pressure was reflected in market breadth, with 63 decliners recorded against only four gainers during one of the week’s weakest sessions.
The market subsequently stabilised. The ASI gained 0.06% on Thursday and another 0.28% on Friday, allowing investors to recover some of the earlier losses.
Despite the late-week recovery, the index ended the second week at 243,052.74 points, representing a 1.60% weekly decline. Market capitalisation fell 1.24% to ₦157.59 trillion.
Weekly turnover also weakened, with 3.65 billion shares valued at ₦130.15 billion changing hands in 244,777 deals. Volume declined 16.35%, while value fell 38.11% compared with the preceding week.
Financial services remained the dominant segment, accounting for 2.91 billion shares valued at ₦56.67 billion, representing 79.76% of total volume and 43.54% of total value.
The weakness in the broader market was reflected in the sectoral performance, although the Oil and Gas Index gained 2.83%, the Commodity Index advanced 2.19%, the MERI Value Index rose 0.79% and the AFR Div Yield Index increased 0.71%.
Overall market breadth for the week remained weak, with only nine gainers against 80 decliners and 58 stocks unchanged.
Buyers Return as Market Regains Momentum
The market staged a strong recovery in the third week as investors returned to selected equities following the sharp correction.
The ASI gained 0.10% on Monday to 243,299.24 points, followed by a 0.41% increase on Tuesday to 244,304.51 points. It advanced another 0.20% on Wednesday before rising 0.62% on Thursday.
The strongest move came on Friday when the ASI jumped 1.42% to 249,804.56 points. The gain lifted the market back towards the 250,000-point level and reinforced the return of buying interest.
The week ended with the ASI up 2.78%, while market capitalisation increased by 2.90% to ₦162.16 trillion. The year-to-date return rose to 60.53%.
Friday’s session was particularly active, with 526.01 million shares changing hands for ₦96.91 billion. Seplat dominated value turnover, accounting for ₦67.51 billion.
For the full week, investors traded 3.25 billion shares worth ₦237.99 billion in 287,919 deals.
Financial services once again accounted for the largest share of activity, with 2.58 billion shares valued at ₦97.21 billion. The sector represented 79.43% of total weekly volume and 40.85% of value.
Services accounted for 131.10 million shares valued at ₦2.73 billion, while ICT stocks recorded 114.62 million shares worth ₦21.54 billion.
Fidelity Bank, Sterling Financial Holdings and Mutual Benefits Assurance together accounted for 1.23 billion shares valued at ₦15.94 billion, representing a significant portion of the week’s trading activity.
Market breadth also improved, with 52 gainers against 32 decliners and 63 stocks unchanged.
ASI Leaps Above 250,000 Points
The fourth week became another major milestone for the market as the ASI crossed the 250,000-point psychological level.
On September 21, the index gained 0.14% to close at 250,156.80 points. The move represented the first close above the 250,000-point mark and was supported by continued demand for selected large-cap stocks.
The market advanced another 0.18% on September 22 to 250,614.66 points. Trading activity remained firm, with 837.26 million shares exchanged for ₦48.57 billion.
On September 23, the ASI added another 0.23% to reach 251,191.02 points. The market recorded significant activity, with 1.59 billion shares traded for ₦45.82 billion.
The upward trend continued on September 24, when the index rose 0.38% to 252,149.78 points. CMFC gained 10%, while market breadth stood at 28 gainers against 24 decliners.
By the end of the week, the ASI had gained 0.92% to close at 252,113.41 points. Market capitalisation stood at ₦163.66 trillion, while the year-to-date return reached 62.01%.
Friday trading remained active, with value rising 16.31% to ₦58.35 billion. About 708.85 million shares were traded in 42,496 deals, while 38 stocks gained against 27 decliners and 81 unchanged stocks.
Zichis gained 10% during the session, while TotalEnergies declined 10%.
New High Before Profit-Taking
The market extended its rally on September 28, with the ASI gaining 0.21% to reach a fresh record of 252,635.11 points.
The session produced one of the month’s strongest trading volumes, with 1.02 billion shares exchanged in 61,661 deals for ₦39.56 billion.
Fidelity Bank dominated trading volume with 528 million shares, representing about 51.52% of total market volume and 26.88% of total value.
Access Holdings accounted for another 5.56% of market volume, while Chams Holding Company contributed 4.04%.
The market also recorded notable movements among individual stocks. UPDC Real Estate Investment Trust crossed its previous 52-week high of ₦19.85 and closed at ₦19.95, while Legend Internet closed at ₦3.35, below its previous 52-week low of ₦3.40.
The new high, however, marked the beginning of a reversal as investors began locking in gains.
Profit-Taking Dominates Final Sessions
After reaching its record level, the market came under renewed selling pressure.
On September 29, the ASI fell 0.29% to 251,913.20 points, while market capitalisation declined by ₦468.63 billion. The decline was driven largely by profit-taking in several heavyweight stocks.
Unilever fell 8.55%, May & Baker declined 5.09%, GTCO lost 3.29%, Ecobank Transnational declined 2.86%, Access Holdings fell 2.51%, BUA Cement lost 3.10%, while Zenith Bank declined 1.03%.
Trading volume dropped to 548.67 million shares valued at ₦34.30 billion in 47,301 deals.
GTCO accounted for 88.73 million shares valued at ₦11.73 billion, making it one of the most actively traded stocks during the session.
Despite the broad selling pressure, some stocks recorded strong gains. LivingTrust Mortgage Bank and NPF Microfinance Bank each gained 10%.
The final session of the month extended the correction. The ASI declined 701.53 points, representing a 0.28% loss, to close at 251,211.67 points.
Market capitalisation fell ₦425.73 billion to ₦163.10 trillion, while the year-to-date return moderated to 61.43%.
Trading activity remained substantial, with 878.32 million shares exchanged in 44,396 deals, valued at ₦32.31 billion.
The final session’s market breadth was relatively balanced, with 30 stocks advancing, 29 declining and 87 closing unchanged.
The late sell-off did not erase the month’s gains, but it highlighted the growing tendency of investors to lock in profits after the strong appreciation recorded across the Nigerian equities market during the year.
Sector and Investor Activity
Financial services remained the dominant force behind trading activity throughout September. The sector repeatedly accounted for the majority of market volume and remained central to the market’s overall direction.
The concentration of turnover in banks and other financial stocks reflected both their large representation on the NGX and continued investor interest in the sector.
The Oil and Gas segment also produced notable performances during the month, particularly as Seplat and other energy stocks attracted buying interest. The sector recorded strong movements during the first and second weeks, with the Oil and Gas Index gaining 2.22% in one of the early sessions and 2.83% during the second week.
Consumer and industrial stocks, however, experienced more mixed performances, with several counters coming under pressure during the mid-month correction.
The overall pattern suggests that investors remained selective, moving between sectors and individual stocks rather than applying broad-based buying pressure across the market.
Technical Analysis and Outlook
Technically, the NGX maintained a broad bullish structure throughout September despite the correction towards the end of the month.
The ASI moved from 241,900.53 points at the end of August to an intra-month high of 252,635.11 points before retreating to 251,211.67 points. This movement shows that the market continued to establish higher levels, although the final sessions revealed resistance around the recent record zone.
The 250,000-point level has become an important psychological support. Holding above this level could help maintain the market’s medium-term structure, while a sustained break below it would increase the possibility of further consolidation.
The 249,800-point region provides a secondary support area. A move below this level could expose the index to additional selling pressure, particularly if accompanied by expanding volume and weakening market breadth.
On the upside, the 252,150–252,635-point region represents the immediate resistance zone. The September high of 252,635.11 points remains the key level to watch as investors assess the next direction of the market.
Market breadth will also be important. Although the index recorded a 61.43% year-to-date gain by month-end, the ability of more stocks to participate in further advances will remain important to the sustainability of market momentum.
The October outlook will be shaped by third-quarter earnings expectations, liquidity conditions, monetary policy, foreign exchange developments, crude oil prices and foreign investor participation.
The CBN’s 23% Monetary Policy Rate also remains an important factor. Changes in yields across fixed-income instruments could influence the allocation of funds between equities and debt securities, particularly among institutional investors.
At the same time, the market’s significant year-to-date appreciation may encourage continued profit-taking. Investors are likely to pay closer attention to earnings quality, dividend prospects, valuations and individual corporate fundamentals rather than relying solely on the broader market’s upward momentum.
The ability of the ASI to maintain the 250,000-point area while market breadth remains healthy could therefore become a key technical consideration in the opening weeks of October.
September ultimately ended as another positive month for Nigerian equities. The ASI rose from 241,900.53 points at the end of August to 251,211.67 points, gaining about 3.85% during the month and extending its year-to-date return to 61.43%. Market capitalisation closed at ₦163.10 trillion, while the index reached a fresh monthly high of 252,635.11 points on September 28 before profit-taking pulled it lower. In the final session, the ASI declined 0.28%, market capitalisation fell ₦425.73 billion, and investors traded 878.32 million shares worth ₦32.31 billion in 44,396 deals. Market breadth stood at 30 gainers, 29 losers and 87 unchanged stocks. VFDGROUP led trading volume with 367.32 million shares, while GTCO recorded the highest transaction value.
Among the month’s strongest gainers, CMFC rose 59.41% to close at ₦4.32, UPDCREIT gained 52.96% to ₦20.65, VFDGROUP advanced 42.11% to ₦14.50 and NGXGROUP rose 33.58% to ₦181.00. On the losing side, INTENEGINS declined 19.93% to close at ₦2.25, CHAMS fell 19.85% to ₦3.19, AUSTINLAZ dropped 19.12% to ₦2.20, TRANSPOWER lost 18.94% to ₦178.00, while REGALINS declined 18.60% to ₦0.70.
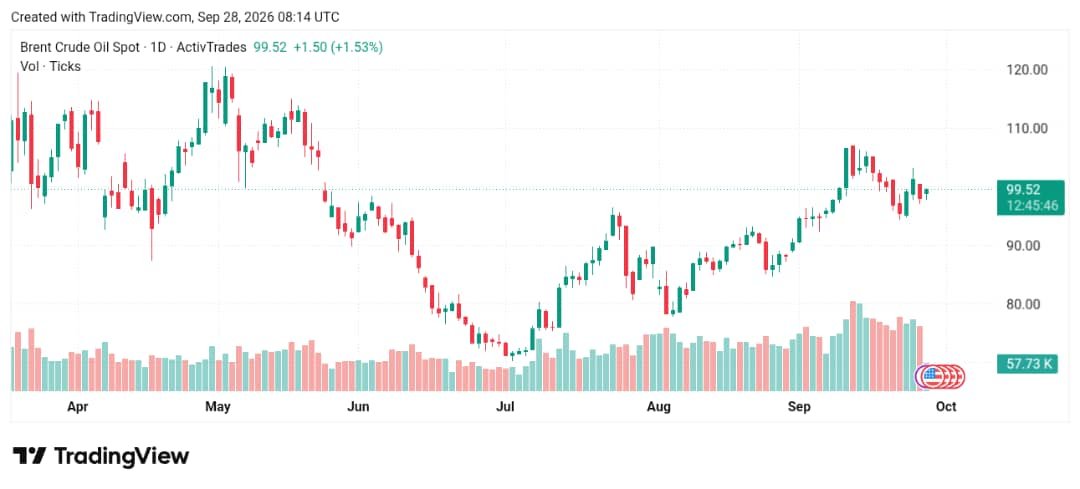
Global Market and Oil: Global financial markets ended September on a cautious note as rising oil prices, higher government bond yields, persistent inflation and geopolitical tensions reshaped investor sentiment. Equities remained relatively resilient despite increased volatility, while the bond market came under significant pressure. Oil emerged as the strongest-performing major commodity, with Brent crude gaining about 14% during the month and moving above $100 per barrel as concerns over Middle Eastern supply intensified.
Global equities lost some momentum in September after a strong third quarter. The MSCI global equity index declined by more than 1%, while European equities recorded their first monthly decline in six months. Despite the September weakness, global equity indexes remained more than 12% higher in 2026 and around 2% below their record highs at the end of the third quarter. Strong corporate earnings expectations, particularly in the technology sector, continued to support equities, although rising bond yields increasingly challenged valuations.
In the United States, the S&P 500 closed September 30 at 7,651.54, down 19.30 points or 0.3% on the day. The index remained 11.8% higher year-to-date, representing a gain of 806.04 points. The Dow Jones Industrial Average fell 443.87 points or 0.9% to 50,906.05, leaving it 5.9% higher for the year, equivalent to a gain of 2,842.76 points. The Nasdaq Composite gained 63.52 points or 0.2% to 26,861.06 and remained 15.6% higher year-to-date, representing a gain of 3,619.07 points. The Russell 2000 declined 11.06 points or 0.4% to 2,796.86 but remained 12.7% higher for the year, up 314.96 points.
The final US trading session reflected conflicting economic signals. Softer-than-expected inflation provided some support for equities, while stronger economic activity pushed Treasury yields higher and renewed pressure on valuations. Technology stocks remained supported by expectations of strong earnings and continued investment in artificial intelligence, with S&P 500 earnings expected to increase by at least 30% in 2026.
European equities also weakened during September. The STOXX 600 was heading for a monthly decline of about 2.5%, ending a five-month winning streak. The DAX closed around 25,199.19, while the CAC 40 stood at 7,997.07 and the FTSE 100 at 10,606.00. The Euro Stoxx 50 was around 6,309. Higher energy costs increased concerns that inflation could remain above central-bank targets, while rising government borrowing costs added to pressure on European markets.
Asian markets were mixed. The Nikkei 225 closed September 30 at 66,753.72, gaining 1.94%, while the Hang Seng rose 0.37% to 24,613.27. The Shanghai Composite increased 0.31% to 3,842.19, while the CSI 300 gained 0.29% to 4,357.62. Singapore’s Straits Times declined 0.68% to 5,675.88, while the Hang Seng China Enterprises Index rose 0.50% to 8,220.08. Despite the final-day gains in some markets, South Korea’s KOSPI fell almost 20% during the third quarter, although it remained roughly twice its level a year earlier.
The bond market was one of the biggest sources of concern during September. Global government bonds recorded one of their weakest periods in years as investors demanded higher yields because of persistent inflation risks, heavy government borrowing and stronger economic activity. The US 10-year Treasury yield climbed to around 5.29%, its highest closing level since 2002. It increased by approximately 87.2 basis points during the third quarter, marking its largest quarterly rise since 1994. The 30-year Treasury yield reached about 5.64%, also around its highest level since 2002, while the two-year yield rose to approximately 4.89%.
The rise in Treasury yields pushed bond prices lower and increased financing costs for governments, companies and households. The pressure also extended to other developed markets, with government bond yields in Japan, Germany, France and Britain reaching multi-year highs during the quarter.
The Federal Reserve raised its benchmark interest rate by 25 basis points at its September 16 meeting, taking the federal funds target range from 3.50%-3.75% to 3.75%-4.00%. The decision was approved unanimously by 12-0. The central bank said economic activity was expanding at a solid pace, domestic spending remained resilient and capital investment was robust, while inflation remained elevated. The Fed continued to target 2% inflation.
US economic data remained relatively firm. Second-quarter GDP growth was revised to 2.2%, reflecting stronger consumer spending, business investment and government expenditure. The August personal consumption expenditures price index, the Federal Reserve’s preferred inflation measure, stood at 3.4%, significantly above the central bank’s 2% target. However, softer-than-expected inflation data released toward the end of September reduced immediate expectations of another rate increase in October.
The US dollar strengthened during the month as higher Treasury yields supported demand for dollar-denominated assets. The WSJ Dollar Index gained 1.38% during September, rising 1.32 points to 97.04. The index recorded its strongest monthly increase since June 2026 and ended a two-month losing streak. Despite the September increase, it remained 7.71% below its 2022 record close of 105.14. It was 1.17% higher year-to-date and 2.13% above its level a year earlier.
Gold experienced a sharp correction in September. Spot gold declined approximately 6.6% during the month to around $4,152.86 per ounce on September 30, while US gold futures settled at $4,186.70 per ounce, gaining 0.2% during the final session. The decline followed a strong August rally, when gold gained 13.3% to close at $4,563 per ounce. Gold’s 2026 record high was $5,405 per ounce, reached on January 29. Higher Treasury yields and a stronger dollar were major factors behind the September correction, although geopolitical uncertainty continued to support safe-haven demand.
Oil Market
Oil was the dominant commodity story during September. Brent crude gained approximately 14% during the month, while West Texas Intermediate rose about 5.5%. The November Brent contract traded at $103.71 per barrel on September 30, gaining $1.12 or 1% during the session. The more active December Brent contract stood at $98.81, up $2.65 or 2.8%. WTI traded at $91.98 per barrel, rising $1.98 or 2.2% during the final session.
The oil rally was driven largely by geopolitical tensions, stalled US-Iran negotiations and concerns over Middle Eastern supply. The possibility of prolonged disruption to crude exports and refined-product supplies pushed the geopolitical risk premium higher and helped Brent move above $100 per barrel.
The sharp increase demonstrated the sensitivity of the global oil market to developments in the Middle East, particularly because the region accounts for a significant share of global crude production and exports. Diplomatic developments occasionally caused prices to retreat as traders assessed the possibility of improving supply conditions.
US fuel inventories provided another source of support for the oil market. In the week ended September 25, US gasoline inventories fell by 1.7 million barrels to 204.4 million barrels, while distillate inventories declined by 2.3 million barrels to 105.2 million barrels. Crude inventories, however, increased by 922,000 barrels to 427.3 million barrels. Analysts had expected crude inventories to decline by approximately 264,000 barrels.
The decline in gasoline and distillate inventories highlighted tightness in refined-product markets and helped maintain upward pressure on oil prices despite the increase in crude stocks.
OPEC+ remained an important factor in the global supply outlook. The group had been gradually reversing earlier production cuts, but geopolitical disruptions meant that additional production did not necessarily translate into equivalent increases in global exports. As a result, investors continued to focus on actual production, exports, refinery activity and inventory levels rather than official production targets alone.
Brent’s September rally extended a much larger quarterly increase. The benchmark gained approximately 40% during the third quarter and was around 70% higher year-to-date by the end of September. The quarterly increase represented Brent’s second-largest quarterly gain since the second quarter of 2020, when the COVID-19 pandemic caused extraordinary disruption across global oil markets.
The increase in crude prices created another challenge for central banks because higher oil prices feed directly into petrol, diesel, aviation fuel, transportation and production costs. These costs can eventually filter through to food, manufacturing and services, making inflation more difficult to control.
For oil-importing economies, higher crude prices can also widen trade deficits, increase fuel subsidies and place additional pressure on foreign-exchange markets. Oil-producing economies, however, can benefit from stronger export revenues and improved government receipts.
Emerging markets therefore experienced mixed conditions during September. Higher US Treasury yields and a stronger dollar increased pressure on emerging-market currencies and raised the cost of dollar-denominated borrowing. Oil exporters benefited from higher crude prices, while countries heavily dependent on imported energy faced increased inflation and external financing pressures.
October Outlook
The direction of global markets in October will largely depend on the interaction between oil prices, inflation, interest rates, bond yields and geopolitical developments.
A sustained Brent price above $100 per barrel could increase inflationary pressure and make it more difficult for central banks to ease monetary policy. It could also keep long-term bond yields elevated and place additional pressure on equity valuations.
An improvement in US-Iran negotiations, a recovery in Middle Eastern exports or weaker global oil demand could have the opposite effect by reducing the geopolitical premium in crude prices and easing inflation concerns.
Investors will also monitor US inflation, employment, consumer spending and economic-growth data for indications about the Federal Reserve’s next policy decisions.
Conclusion
September 2026 was characterised by a sharp increase in oil prices and government bond yields, while global equities remained comparatively resilient. Global equity indexes ended the quarter more than 12% higher year-to-date, but the US 10-year Treasury yield moved above 5%, creating a significant challenge for global asset markets.
Oil delivered strong momentum, with Brent gaining about 14% in September, approximately 40% during the third quarter and around 70% year-to-date. Gold, meanwhile, declined 6.6% during September as higher yields and a stronger dollar reduced demand.
The combination of Brent above $100 per barrel, a US 10-year Treasury yield around 5.3%, a Federal Funds rate of 3.75%-4.00% and PCE inflation of 3.4% leaves global markets entering October with a delicate balance between economic growth, persistent inflation, geopolitical risk and tighter financial conditions.