
Period Under Review: -HALF YEAR 2026
Current Share Price: N137.00
Latest Final Dividend: N11.76
Latest Interim Dividend: N1.00
Estimated Beta Value: 0.85x
Estimated Fair Value: N219.41
Ratings: Hold
Analyst: Jeariogbe Tunde Segun
The Company
Guaranty Trust Holding Company Plc (GTCO Plc) traces its history to 1990, when Guaranty Trust Bank Limited was incorporated in Nigeria by a group of young professionals and entrepreneurs led by Fola Adeola and Tayo Aderinokun. It commenced operations in 1991 and built its reputation around strong corporate governance, professionalism, innovation and customer-focused banking. GTBank subsequently expanded its operations beyond Nigeria into other African markets and the United Kingdom, becoming one of Nigeria’s most prominent financial institutions, ahead of much older competitors. It was listed on the Nigerian Stock Exchange (now Nigerian Exchange Limited) in 1996 and later became one of the country’s most widely held and recognized banking stocks.
In 2021, GTBank completed a corporate restructuring that transformed it into a financial holding company- Guaranty Trust Holding Company Plc (GTCO), housing the banking and other financial-services businesses operating as subsidiaries. The restructuring was designed to broaden the group’s financial-services offerings beyond traditional commercial banking into areas such as payments, pensions, asset management and other related businesses.
Since the transition, GTCO has continued to operate as a diversified financial-services group, with Guaranty Trust Bank Limited remaining its principal banking subsidiary, with the group maintaining a strong presence in Nigeria and selected African markets.
Statement of Comprehensive Income
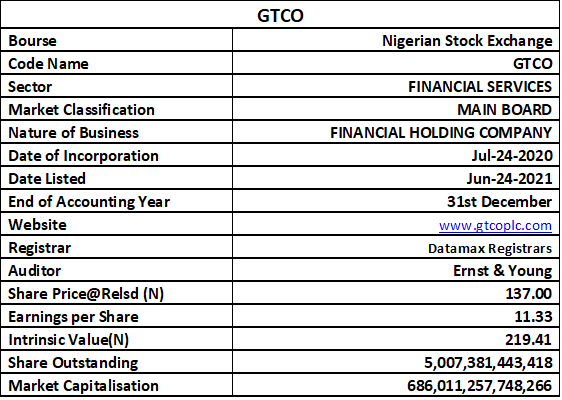
According to its scorecard released just released, GTCO Plc recorded gross earnings of ₦1.107 trillion in in the first half of 2026, representing a 3.25% increase from ₦1.073 trillion in the corresponding period of 2025. Interest income grew by 7.51% to ₦873.390 billion from ₦812.360 billion, while interest expenses rose more sharply by 24.24% to ₦223.787 billion from ₦180.122 billion. Consequently, net interest income increased only marginally by 2.75% to ₦649.604 billion, compared with ₦632.238 billion in the corresponding period. The figures indicate that the growth in interest income was substantially absorbed by the higher cost of funds.
Operating expenses remained relatively controlled, rising by just 1.31% to ₦223.081 billion from ₦220.197 billion. However, depreciation increased significantly by 41.82%, from ₦38.292 billion to ₦54.306 billion. Despite these cost pressures, GTCO’s profit before tax (PBT) rose marginally by 0.35% to ₦603.034 billion from ₦600.901 billion. The modest PBT growth suggests that the group’s ability to convert higher revenue into additional pre-tax earnings was constrained during the period, particularly by higher interest expenses and depreciation charges.
After tax performance, however, weakened, declining by 7.76% to ₦414.186 billion from ₦449.011 billion in H1 2025. Tax expense increased substantially by 24.33% to ₦188.848 billion from ₦151.890 billion, contributing significantly to the decline in bottom-line earnings. Total comprehensive income was even more affected, falling by 43.45% to ₦305.557 billion from ₦540.354 billion. Overall, the H1 2026 numbers show that while GTCO maintained strong earnings capacity and modestly increased PBT, higher funding costs, depreciation and tax charges exerted considerable pressure on shareholder earnings and comprehensive income.
Statement of Financial Position
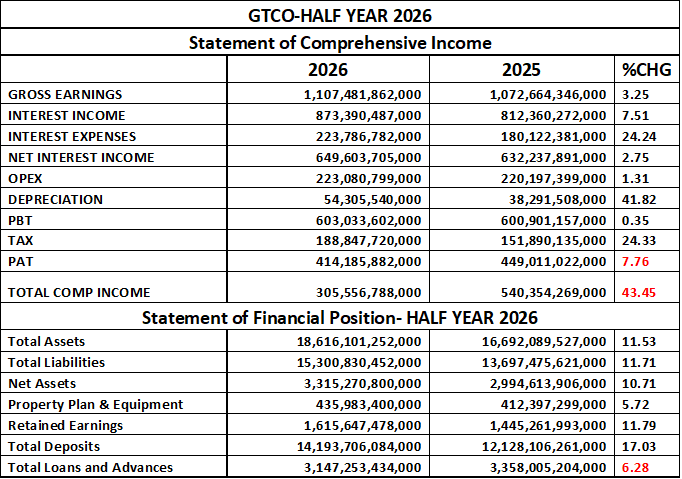
GTCO Plc recorded a strong expansion in its balance sheet during the first half of 2026. Total assets increased by 11.53% to ₦18.616 trillion, compared with ₦16.692 trillion in H1 2025, while total liabilities rose by 11.71% to ₦15.301 trillion from ₦13.697 trillion. Consequently, net assets increased by 10.71% to ₦3.315 trillion, compared with ₦2.995 trillion in the corresponding period. The growth in assets and net assets indicates an overall strengthening of the group’s financial position during the period.
A major driver of the balance-sheet expansion was the substantial growth in customer deposits. Total deposits rose by 17.03% to ₦14.194 trillion, from ₦12.128 trillion in H1 2025, representing an additional ₦2.066 trillion in deposit liabilities. Retained earnings also increased by 11.79% to ₦1.616 trillion, from ₦1.445 trillion, reflecting the group’s continued capacity to accumulate earnings within the business. Property, plant and equipment increased by 5.72% to ₦435.983 billion, indicating continued investment in the group’s physical and operational infrastructure.
However, total loans and advances declined by 6.28% to ₦3.147 trillion, from ₦3.358 trillion in H1 2025. This is in contrasts with the 17.03% growth in deposits, suggesting that deposit growth was not matched by corresponding expansion in loans and advances during the period. Overall, GTCO’s H1 2026 financial position shows strong deposit mobilisation, higher assets and net assets, and improved retained earnings, although the decline in loans and advances remains an important area to monitor because of its implications for asset utilisation and future interest-income growth.
Financial Strength/ Solvency Ratio
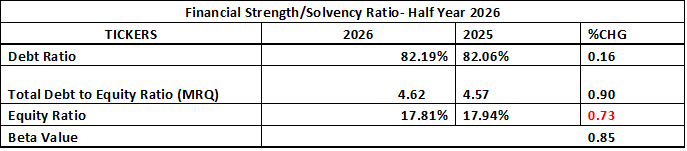
GTCO Plc’s H1 2026 solvency indicators show a relatively stable capital structure, although leverage increased slightly during the period. The debt ratio rose marginally to 82.19% from 82.06%, while the total debt-to-equity ratio increased to 4.62x from 4.57x, indicating a modest increase in leverage. Conversely, the equity ratio declined to 17.81% from 17.94%, reflecting a slight reduction in the proportion of assets financed by equity. With a beta of 0.85, GTCO’s share has historically exhibited lower sensitivity to broad market movements than a beta of 1.0 would imply. Overall, the ratios point to a largely stable solvency position, with the small rise in leverage and corresponding decline in equity funding worth monitoring.
Profitability Ratios
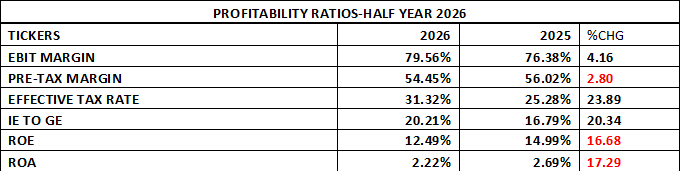
GTCO Plc’s profitability indicators for H1 2026 present a mixed picture. EBIT margin improved to 79.56% from 76.38%, representing a 4.16% increase, indicating stronger operating profitability. However, the pre-tax margin declined to 54.45% from 56.02%, while the effective tax rate increased significantly to 31.32% from 25.28%. The higher tax burden therefore absorbed part of the gains achieved at the operating level. Meanwhile, the interest expense-to-gross earnings ratio increased to 20.21% from 16.79%, indicating that interest costs consumed a larger proportion of gross earnings during the period.
The decline in shareholder and asset returns is more notable. ROE fell to 12.49% from 14.99%, while ROA declined to 2.22% from 2.69%, representing reductions of 16.68% and 17.29%, respectively. This suggests that despite the improvement in operating margin, GTCO generated lower returns from both shareholders’ equity and its asset base compared with H1 2025. Overall, the H1 2026 profitability profile reflects strong operating margins but weaker bottom-line efficiency and returns, with higher interest costs and taxation contributing to the pressure on ROE and ROA.
Efficiency Ratios
GTCO Plc’s H1 2026 efficiency ratios show an improvement in operating cost management but a reduction in asset and lending utilization. Operating expenses to gross earnings (OPEX/GE) declined marginally to 20.14% from 20.53%, indicating that a slightly smaller proportion of gross earnings was consumed by operating expenses. However, gross earnings to total assets (GE/TA) fell to 5.95% from 6.43%, suggesting lower income generation relative to the size of the asset base. More significantly, the loan-to-deposit ratio (LDR) declined to 22.17% from 27.69%, reflecting the weaker growth in loans and advances relative to the substantial increase in customer deposits. Overall, the ratios indicate improved operating-cost efficiency, but reduced asset-income productivity and a lower level of deposit deployment into loans during the period.

Investment/Valuation Ratios
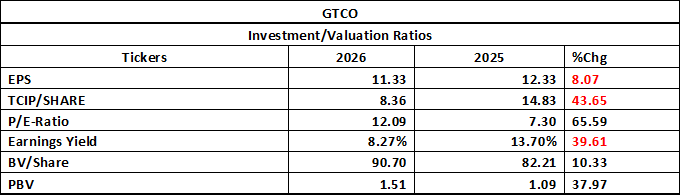
GTCO Plc’s H1 2026 investment and valuation indicators show a decline in earnings performance but continued growth in shareholders’ underlying book value. EPS declined by 8.07% to ₦11.33 from ₦12.33, while TCI per share fell sharply by 43.65% to ₦8.36 from ₦14.83. In line with the lower earnings, the earnings yield declined to 8.27% from 13.70%. The P/E ratio increased to 12.09x from 7.30x, indicating that the market valuation relative to earnings has risen despite the decline in EPS. The inverse of the 2026 earnings yield of 8.27% gives approximately 12.09x.
On the balance-sheet valuation side, book value per share increased by 10.33% to ₦90.70 from ₦82.21, reflecting growth in the net asset value attributable to each share. However, the price-to-book ratio (PBV) increased by 37.97% to 1.51x from 1.09x, indicating that the market is placing a higher premium on GTCO’s book value than in the previous year. Overall, the H1 2026 valuation picture is characterized by lower earnings and earnings yield, higher P/E and PBV multiples, and stronger book value per share. This suggests that while the company’s underlying net worth continues to expand, the market valuation has become relatively higher compared with both current earnings and book value.
Half Year Dividend Ratios
GTCO Plc maintained its latest final dividend at ₦1.00 per share in H1 2026, unchanged from the previous year. However, the final dividend payout ratio increased to 8.82% from 8.11%, representing 8.78% improvement, indicating that a slightly larger proportion of earnings was distributed to shareholders. Despite the unchanged dividend, the final dividend yield declined to 0.73% from 1.11%, a 34.31% reduction, reflecting the higher market price relative to the dividend paid. Overall, the dividend record remained stable in nominal terms, while the increase in payout ratio and decline in dividend yield point to changes in the relationship between earnings, dividend distribution and the share price.

Final Verdict on GTCO Plc
GTCO Plc’s H1 2026 results present a mixed performance profile. The group remains financially strong, with total assets rising 11.53%, deposits increasing 17.03%, net assets growing 10.71%, and book value per share improving 10.33% to ₦90.70 each. Operating-cost efficiency also improved, while the debt and solvency indicators remained broadly stable.
However, earnings momentum weakened: PAT fell 7.76%, EPS declined 8.07% to ₦11.33, ROE dropped from 14.99% to 12.49%, ROA from 2.69% to 2.22%, and loans and advances declined 6.28% despite strong deposit growth. The P/E of 12.09x, and PBV of 1.51x indicate a higher valuation relative to earnings and book value. Therefore, based strictly on the H1 2026 figures, HOLD is the appropriate rating, with the key determinants for a future reassessment being recovery in EPS, ROE and ROA, stronger loan deployment, and improved control of interest and tax costs.