
Chellarams Plc is one of Nigeria’s long-established trading and industrial businesses with corporate history dating back to 1947 and operations spanning: industrial chemicals, polyurethane products, plastic films, machinery, consumer goods, and technical services.
Chellarams was incorporated on August 13, 1947 and admitted onto the Nigerian Stock Exchange in November 1974. The company’s own brand story also talks of serving Nigeria since 1923, reflecting the longer history of the Chellaram business presence in the country.
Current price: N9.70
Rating: Buy
Price projection: N14 and N18
Technical Analysis
In this report, we shall use the following tools and analysis methods:
Elliott’s wave theory to understand the overall market sentiment
Fibonacci tools to determine support and resistance levels
The Relative Strength Index and volume to evaluate the market’s strength
The Money Flow Index to determine the market liquidity
Moving average and MACD to understand the nature of the trend
Top-down analysis to know the best investment position
Elliott wave analysis
Weekly chart: Market overview
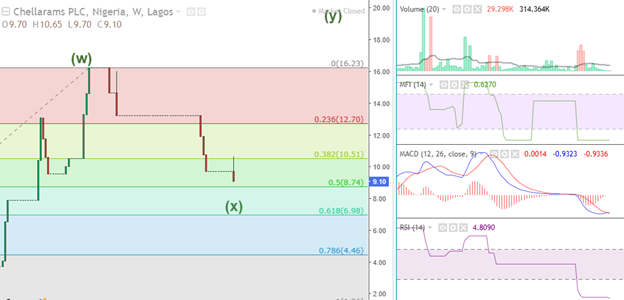
Chellarams retraced to the 0.5 Fibonacci level, which suggests that investors should watch for a trend reversal. In line with this sentiment, MACD sustained its divergence signal. Thus, investors should watch for improved liquidity and volume to determine the stock’s outlook.
Daily chart: Trading opportunity
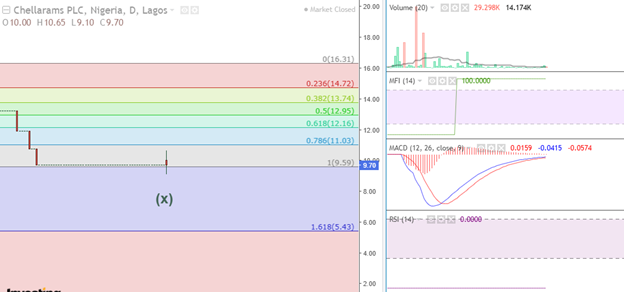
On the daily chart, Chellaram retraced to the 0.1 Fibonacci level, which is equal to the stock’s last impulsive wave (Wave 5). This position usually attracts trend exhaustion and reversal. Thus, market players should watch N9 and N8 as potential support levels. The price projections for Chellaram include N14 and N18.