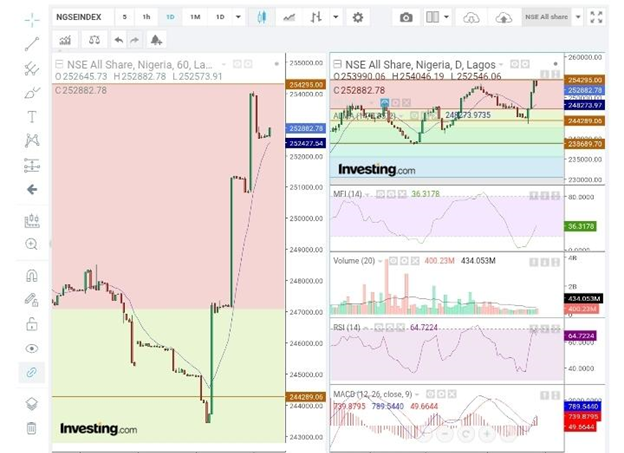


As the NGX market remains strong and positive, some equity companies have shown signs of recovery. In this article, we’ll discuss these stocks and project potential profit-taking zones for investors who bought into value during the corrective phase.
Technical Analysis Tools
In this report, we shall use the following tools and analysis methods:
Elliott’s wave theory to understand the overall market sentiment
Fibonacci tools to determine support and resistance levels
The Relative Strength Index and volume to evaluate the market’s strength
The Money Flow Index to determine the market liquidity
Moving average and MACD to understand the nature of the trend
Top-down analysis to know the best investment position
Stocks to Watch
1. Consolidated Hallmark Plc
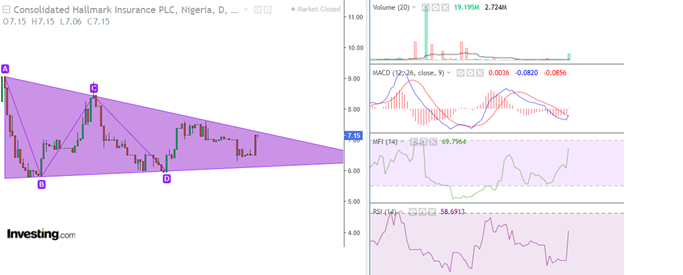
Consolidated Hallmark launched the week with strong bullish momentum. This performance strengthened the stocks’ recovery phase within the corrective triangle. In line with this performance, its liquidity and relative strength improved exponentially. MACD also sustained its divergence signal, preparing for a trend reversal. Thus, a breakout above this triangle should confirm a buy-in opportunity. The price projections for CONHALL include N9 and N11.
2. University Press Plc
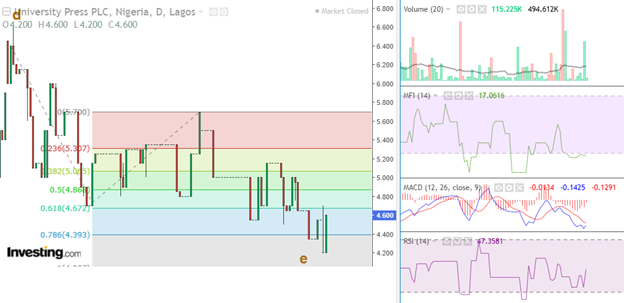
On September 7, 2026, University Press technical analysis suggested that traders and investors should watch N4 and 4.5 as potential support levels within the 1.0 Fibonacci level. At N4.20, the stock experienced strong bullish momentum, launching its recovery phase. In line with this performance, MACD sustained its divergence signal, aligning to the market sentiment. As UPL’s relative strength and volume remain solid, market participants should watch for improved liquidity to confirm the buy-in opportunity. The price projections for UPL include N7.5 and N8.5.
3. AXA Mansard Insurance Plc
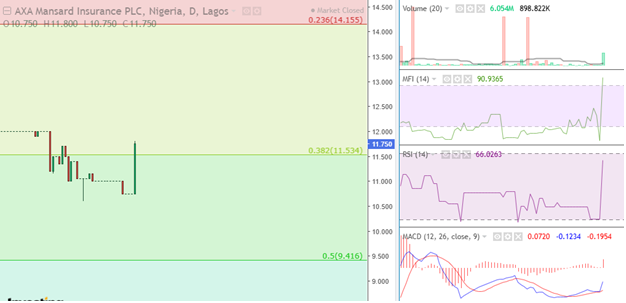
AXA Mansard saw strong support within the 0.5 Fibonacci level and initiated its recovery phase. In line with this performance, the stock’s liquidity, volume, and momentum improved exponentially. Investors and traders should watch for a pullback to buy into value, with prices projected at N18 and N22.
4. African Prudential Plc
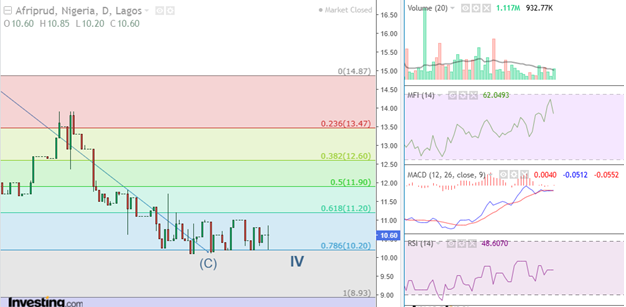
On September 9, 2026, African Prudential technical analysis suggested that market players should watch N10 and N8 as potential support levels. The stock retraced and tested the 1.0 Fibonacci level and closed with a doji candlestick pattern. This performance usually signals a trend reversal.
In line with this performance, the stock’s relative strength and momentum improved. MACD also initiated its bullish momentum. Thus, traders and investors should watch for sustained liquidity to determine the stock’s outlook. The price projections for AFRIPRUD include N17.50 and N19.
5. UPDC Plc
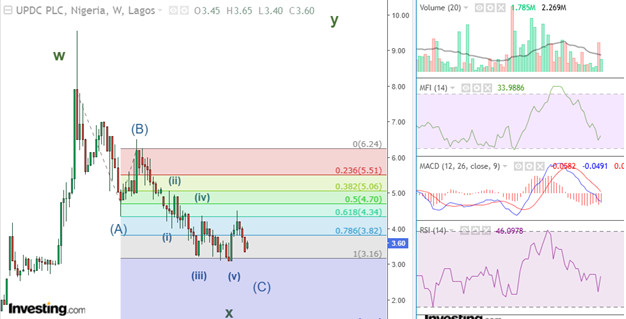
UPDC experienced a 3-3-5 corrective phase. On August 26, 2026. UPDC technical analysis suggested that investors should watch N3 and N2.50 as potential support levels. The stock retraced to the 1.0 Fibonacci level and met support at N3.10. This performance improved its recovery strength.
In line with this performance, UPDC’s liquidity, relative strength, and volume improved. MACD also launched its divergence signal. Thus, market players should watch for continued improved momentum and liquidity to discover buy-in opportunities. The price projections for UPDC include N5, N6, and N10.