
Period Under Review: HALF YEAR 2026
Current Share Price: N163.00
Latest Final Dividend: N
Latest Interim Dividend: N4.50
Estimated Beta Value: 0.44x
Estimated Fair Value: N235
Ratings: Buy
Analyst: Jeariogbe Tunde Segun
The Company
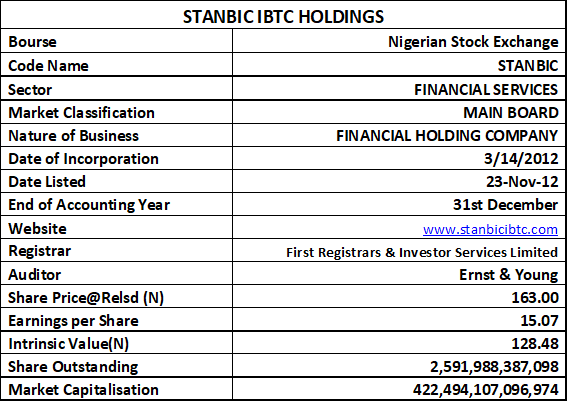
Stanbic IBTC Holdings Plc is a Nigerian financial services group which began operations in Nigeria as a private limited liability merchant bank on March 1, 1989, as Investment Banking & Trust Company (IBTC). Over the years, Stanbic IBTC expanded from investment banking into commercial banking, asset management, pension administration, stockbroking, trusteeship and other financial services. A major milestone came in 2007, when IBTC Chartered Bank (itself the outcome of a business combination between IBTC Plc and the then Chartered Bank Plc) merged with Stanbic Bank Nigeria, a member of the Standard Bank Group of South Africa, creating Stanbic IBTC Bank Plc. The combination brought together IBTC’s established Nigerian financial-services franchise and Standard Bank’s wider African and international network.
Following the restructuring, Stanbic IBTC Holdings Plc became the holding company for the various businesses, with Stanbic IBTC Bank Limited as its principal banking subsidiary. The group today operates across banking, wealth management, investment banking and related financial services, serving individuals, businesses, institutions and government-related clients. Its connection with Standard Bank Group, Africa’s largest banking group by assets, has also provided access to broader expertise, capital and international financial markets. Over the decades, Stanbic IBTC has therefore evolved from an investment-banking institution into a diversified Nigerian financial-services group with operations spanning several major segments of the financial sector.
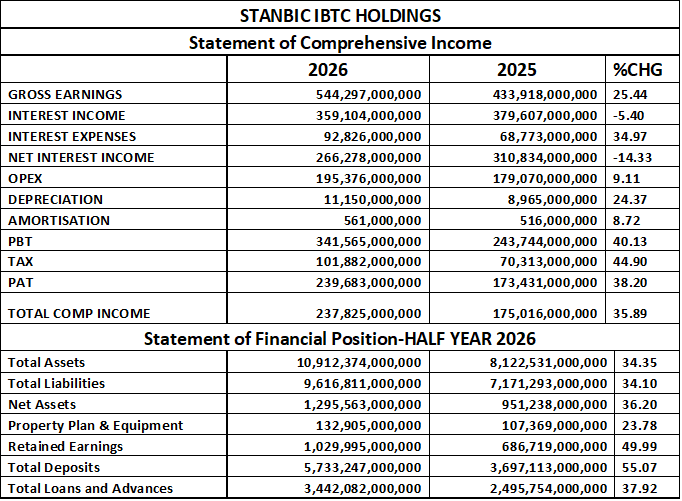
Statement of Comprehensive Income
Stanbic IBTC Holdings’ 2026 results show a strong expansion in gross earnings, which increased by 25.44% from ₦433.918 billion in the first half of 2025 to ₦544.297 billion in the same period of 2026. However, the growth in gross earnings was not driven by interest income (the lifeblood of any banking institution), which declined by 5.40% from ₦379.607 billion to ₦359.104 billion. Interest expenses, on the other hand, rose sharply by 34.97% from ₦68.773 billion to ₦92.826 billion, resulting in a 14.33% decline in net interest income, from ₦310.834 billion to ₦266.278 billion. This indicates that the major pressure on the income statement came from the interest-income/interest-expense spread.
Despite the contraction in net interest income, the Group achieved a substantial 40.13% growth in profit before tax (PBT), from ₦243.744 billion in 2025 to ₦341.565 billion in the 2026 half-year. This suggests that the strong increase in gross earnings was supported by other income-generating activities outside net interest income. Operating expenses increased by a relatively moderate 9.11%, from ₦179.070 billion to ₦195.376 billion, while depreciation increased by 24.37% and amortisation by 8.72%. The relatively slower growth in operating expenses compared with PBT contributed positively to the Group’s earnings performance.
Profit after tax (PAT) increased significantly by 38.20%, from ₦173.431 billion to ₦239.683 billion, demonstrating strong bottom-line growth, despite the 44.90% rise in Tax expense from ₦70.313 billion to ₦101.882 billion, growing faster than the PAT and indicating a higher tax burden in absolute terms. Total comprehensive income also rose by 35.89%, from ₦175.016 billion to ₦237.825 billion. Overall, the statement presents a strong improvement in profitability in 2026, although the 14.33% decline in net interest income and 34.97% rise in interest expenses are important areas worthy of attention as they could affect the sustainability of earnings growth, should the trend persist.
Statement of Financial Position
Stanbic IBTC Holdings’ Half-Year 2026 Statement of Financial Position shows significant expansion in the Group’s balance sheet, with Total Assets increasing by 34.35%, from ₦8.123 trillion in 2025 to ₦10.912 trillion in 2026, while total liabilities leaped by 34.10% to ₦9.617 trillion. Consequently, net assets increased by 36.20%, from ₦951.238 billion to ₦1.296 trillion. The growth in shareholders’ funds was supported particularly by retained earnings, which rose by an impressive 49.99%, from ₦686.719 billion to ₦1.030 trillion. Property, plant and equipment also increased by 23.78%, indicating continued investment in the Group’s operating infrastructure.
On the banking side, total deposits grew by 55.07%, from ₦3.697 trillion to ₦5.733 trillion, representing a substantial expansion in the Group’s funding base. Total loans and advances also increased strongly by 37.92%, from ₦2.496 trillion to ₦3.442 trillion, indicating greater deployment of deposits into lending activities. The faster growth in deposits relative to loans provides additional liquidity capacity, while the increase in loans should support future interest income. Overall, the balance sheet reflects a strong growth in assets, deposits, loans and retained earnings, although the accompanying rise in liabilities should be monitored alongside asset quality and funding costs.
Financial Strength/Solvency Ratio
Stanbic IBTC Holdings’ Half-Year 2026 financial strength and solvency ratios indicate a relatively stable capital structure, with a marginal improvement in leverage. The debt ratio declined slightly from 88.29% in 2025 to 88.13% in 2026, while the total debt-to-equity ratio improved from 7.54x to 7.42x, indicating a modest reduction in leverage. Conversely, the equity ratio increased from 11.71% to 11.87%, suggesting a slight strengthening of the Group’s equity position relative to total assets. The reported beta of 0.44 indicates its relatively lower sensitivity to broad market movements. Overall, the ratios point to a stable financial structure with marginal improvement in solvency and leverage, please understand that the high debt ratio remains characteristic of a highly leveraged banking business.

Profitability Ratios
Stanbic IBTC Holdings’ Half-Year 2026 profitability ratios show a broad improvement in earnings performance compared with the corresponding period of 2025. EBIT margin increased from 74.21% to 81.96%, representing a 10.45% improvement, while the pre-tax margin rose from 56.17% to 62.75%, up 11.71%. This indicates that a larger proportion of gross earnings was converted into operating and pre-tax profit. However, the effective tax rate increased moderately from 28.85% to 29.83%, a 3.40% rise, suggesting that the Group experienced a slightly higher tax burden relative to its pre-tax earnings.
The other profitability indicators also recorded positive movements. Interest expense to gross earnings (IE to GE) increased from 15.85% to 17.05%, up 7.60%, indicating that interest costs consumed a larger proportion of gross earnings. Nevertheless, ROE improved from 18.23% to 18.50%, while ROA increased from 2.14% to 2.20%, representing increases of 1.47% and 2.87%, respectively. Overall, the ratios point to improved profitability and better returns generated from both shareholders’ equity, and total assets, although the rising interest-cost ratio and effective tax rate remain areas to monitor.

Efficiency Ratios
Stanbic IBTC Holdings’ Half-Year 2026 efficiency ratios indicate an improvement in operating efficiency. Operating expenses to gross earnings (OPEX/GE) declined from 41.27% in 2025 to 35.90% in 2026, a 13.02% reduction, indicating that a smaller proportion of gross earnings was consumed by operating expenses. Gross earnings to total assets (GE/TA) also improved from 5.34% to 4.99%, while the loan-to-deposit ratio (LDR) declined significantly from 67.51% to 60.04%, suggesting that deposit growth was faster than loan deployment, leaving a larger proportion of deposits available as liquidity. Capex per share remained at approximately ₦0.01. Overall, the ratios point to improved cost efficiency and a more conservative loan-to-deposit position during the period.

Investment/Valuation Ratios
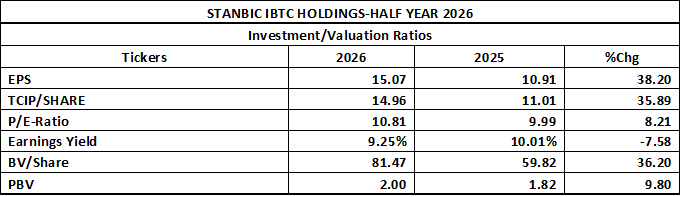
Stanbic IBTC Holdings’ Half-Year 2026 investment and valuation ratios reflect a substantial improvement in earnings and book value. EPS increased by 38.20%, from ₦10.91 in 2025 to ₦15.07 in 2026, while TCIP per share rose by 35.89%, from ₦11.01 to ₦14.96. Similarly, book value per share (BVPS) increased by 36.20%, from ₦59.82 to ₦81.47, reflecting the significant growth in shareholders’ equity. These movements are consistent with the strong growth in PAT and retained earnings reported earlier in this report.
From a market valuation perspective, the P/E ratio increased moderately from 9.99x to 10.81x, representing an 8.21% increase, while the earnings yield declined from 10.01% to 9.25%. The price-to-book ratio (PBV) also increased from 1.82x to 2.00x, indicating that the market price represents a higher multiple of the company’s book value than in the corresponding period. Overall, the ratios show that earnings and intrinsic book value have grown strongly, although the market valuation has also risen, as reflected in the higher P/E and PBV multiples.
Dividend Information
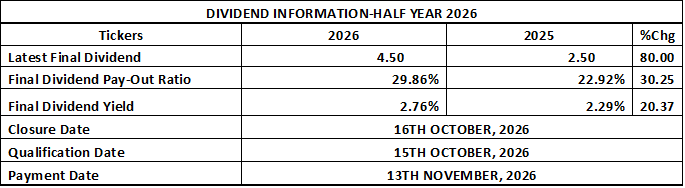
The dividend information for the first half of 2026 indicates an improvement in dividend performance compared with 2025. The latest interim dividend increased from ₦2.50 in 2025 to ₦4.50 in 2026, while the interim dividend payout ratio rose from 22.92% to 29.86%, representing a 30.25% increase. Similarly, the interim dividend yield improved from 2.29% to 2.76%, reflecting a 20.37% increase. These figures suggest improved shareholder returns and a higher proportion of earnings distributed as dividends.
The closure and qualification dates are scheduled for 16 October 2026 and 15 October 2026, respectively. And Payment Date for the said interim dividend is 13th November, 2026. See the table below for details.
Overall verdict: BUY
Stanbic IBTC’s H1 2026 numbers present a strong fundamental performance, characterised by substantial growth in earnings, shareholders’ equity, deposits, loans and returns. The 38.20% growth in EPS, 40.13% increase in PBT and 38.20% rise in PAT are particularly significant, while the improvement in OPEX/GE demonstrates better cost management. The major issues to monitor are the 14.33% decline in net interest income, 34.97% increase in interest expenses and the higher 2.00x PBV. Nevertheless, based strictly on the financial and valuation information observed so far, the combination of strong earnings growth, improved profitability, expanding book value and reasonable P/E of 10.81x supports a BUY rating, subject to the investor’s entry price and investment horizon.