

Quarter Under Preview: First Quarter 2026
Current Share Price: N199
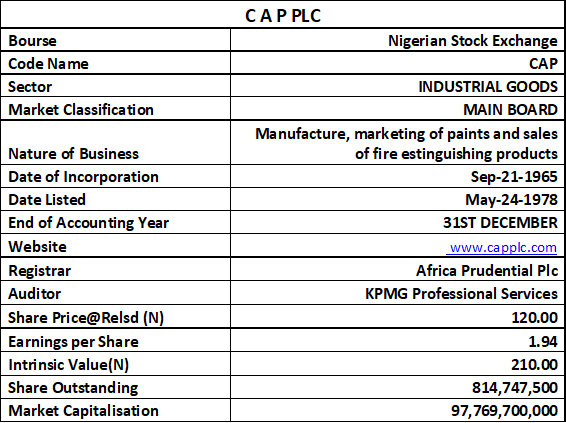
Price At Released Date: N120.00
Latest Final Dividend: N4.00
Latest Interim Dividend: NIL
Estimated Beta Value: 0.50x
Estimated Intrinsic Value: N210.00
Rating: Short-term investors: HOLD- Long Term-Buy
Analyst: Jeariogbe Tunde Segun
The Company
Chemical and Allied Products Plc, popularly known as CAP Plc, traces its origin to the operations of the British multinational- Imperial Chemical Industries (ICI) in Nigeria. The company began operations in 1957 under the name ICI Exports Limited before changing to ICI Nigeria Limited in 1965. In 1968, the business was merged into ICI Paints Limited as the company expanded its presence in the Nigerian paints and coatings industry. Following Nigeria’s indigenisation policy of the 1970s, a substantial portion of the company’s shares was sold to Nigerian investors, leading to the adoption of the name Chemical and Allied Products Limited (CAPL). In 1991, the company became a public limited company and was subsequently listed on the Nigerian Stock Exchange, now (Nigerian Exchange Limited).
Over the decades, CAP Plc has grown into one of Nigeria’s leading paints and coatings manufacturers, operating as the technological licensee of AkzoNobel, makers of the globally recognized Dulux brand. The company focuses mainly on decorative and industrial coatings, marketing products under brands such as Dulux, Sandtex, Caplux, and Hempel. In 1992, UAC of Nigeria Plc acquired majority control of the company, strengthening its corporate structure and market reach. A major milestone in CAP’s recent history was its merger with Portland Paints & Products Nigeria Plc in 2021, a move that further consolidated its leadership position in Nigeria’s paints and coatings industry.
The Released Numbers
CAP Plc recorded a strong financial performance in the first three months of 2026, with turnover increasing by 14.90% to ₦11.59 billion from ₦10.09 billion in the same period of 2025. The growth in revenue reflects improved demand for the company’s paints and coatings products as well as effective market penetration strategies. However, cost of sales also rose by 14.47% to ₦6.51 billion, indicating that production and raw material costs remained under pressure. Despite this, the company maintained healthy profitability, as operating profit grew significantly by 40.03% to ₦2.12 billion, showing improved operational efficiency and stronger gross margins.
Operating expenses (OPEX) increased slightly by 3.59% to ₦3.08 billion, which suggests that the company was able to control administrative and selling expenses relative to revenue growth. Depreciation and amortisation expenses rose by 15.51% and 27.49% respectively, reflecting continued investment in assets and operational infrastructure. Finance cost also increased sharply by 52.80% to ₦102.20 million, likely due to higher borrowing costs or increased financing obligations. Nevertheless, net finance income improved by 37.28% to ₦270.29 million, helping to cushion the impact of rising finance expenses.
Profit Before Tax (PBT) advanced strongly by 39.71% to ₦2.39 billion, while tax expense increased by 43.95% to ₦813.34 million in line with higher earnings. Consequently, Profit After Tax (PAT) rose by 37.63% to ₦1.58 billion compared to ₦1.15 billion recorded in 2025. Total comprehensive income also stood at ₦1.58 billion, reflecting the company’s robust profitability and sustained earnings growth. Overall, the 2026 performance demonstrates CAP Plc’s resilience, efficient cost management, and strong ability to convert revenue growth into improved shareholder value.
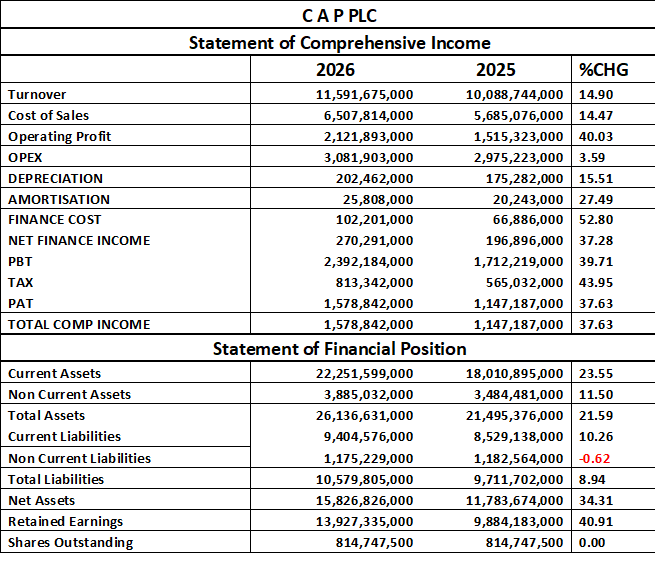
CAP Plc’s Statement of Financial Position for the 2026Q1 shows a significant improvement in the company’s asset base and shareholder value. Current assets increased by 23.55% from ₦18.01 billion to ₦22.25 billion, indicating stronger liquidity and improved working capital management. Non-current assets also grew by 11.50% to ₦3.89 billion, reflecting continued investment in property, plant, equipment, and long-term operational assets. Consequently, total assets expanded by 21.59% to ₦26.14 billion, demonstrating the company’s growing operational scale and financial strength.
On the liabilities side, current liabilities rose moderately by 10.26% to ₦9.40 billion, suggesting higher short-term obligations arising from increased business activities. However, non-current liabilities declined slightly by 0.62% to ₦1.18 billion, which reflects prudent long-term debt management. Overall, total liabilities increased by only 8.94% to ₦10.58 billion, a much slower pace compared to asset growth. This indicates that the company financed a significant portion of its expansion through internally generated funds rather than excessive borrowing.
Net assets strengthened considerably by 34.31% to ₦15.83 billion from ₦11.78 billion, highlighting improved shareholders’ wealth and a stronger equity position. Retained earnings also rose sharply by 40.91% to ₦13.93 billion, supported by robust profitability and earnings retention during the year. Meanwhile, shares outstanding remained unchanged at 814.75 million units, implying that growth in equity was driven mainly by earnings accumulation rather than share dilution. Overall, CAP Plc’s financial position reflects strong balance sheet quality, healthy liquidity, controlled leverage, and sustained value creation for shareholders.
Financial Strength/Solvency Ratio
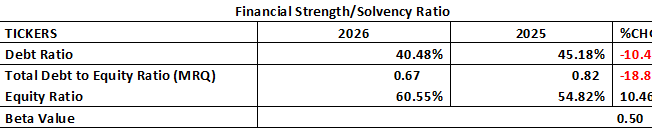
CAP Plc’s financial strength and solvency position improved notably in 2026, reflecting a healthier balance sheet and lower financial risk exposure. The debt ratio declined from 45.18% in 2025 to 40.48% in 2026, representing a 10.41% reduction. This indicates that a smaller portion of the company’s assets was financed through liabilities, showing stronger financial stability. Similarly, the total debt-to-equity ratio fell from 0.82x to 0.67x, a decline of 18.89%, suggesting that the company relied less on borrowed funds and strengthened its equity financing position during the year.
On the other hand, the equity ratio improved from 54.82% in 2025 to 60.55% in 2026, reflecting increased shareholders’ contribution to total assets and improved quality of its capital structure. The rise in equity ratio aligns with the company’s strong retained earnings growth and enhanced profitability performance during the year. In addition, CAP Plc’s Beta value of 0.50 indicates relatively low volatility in relation to the broader market, suggesting that the stock may offer more stability to investors during market fluctuations. Overall, the solvency ratios portray CAP Plc as financially stable, less leveraged, and well-positioned for sustainable long-term growth.
Profitability Ratios
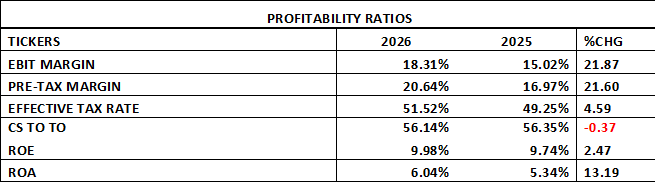
CAP Plc recorded notable improvement in its profit ratios in the 2026Q1, reflecting stronger operational performance and improved earnings generation. EBIT margin increased from 15.02% in 2025 to 18.31% in 2026, representing a 21.87% growth, which indicates that the company generated more operating profit from each naira of revenue. Similarly, pre-tax margin rose from 16.97% to 20.64%, showing enhanced operational efficiency and better cost control despite rising production and finance costs. These improvements demonstrate CAP Plc’s ability to translate revenue growth into stronger profitability.
The company’s cost efficiency also improved slightly during the quarter. Cost of Sales to Turnover ratio declined marginally from 56.35% to 56.14%, indicating better management of production costs relative to sales. However, the effective tax rate increased from 49.25% to 51.52%, suggesting that a larger portion of earnings was absorbed by taxes in the period under review. Despite the higher tax burden, the company still achieved a strong bottom-line growth, reflecting the strength of its core operations and earnings capacity.
Return on Equity (ROE) improved from 9.74% in 2025 to 9.98% in 2026, indicating that shareholders earned slightly higher returns on their invested capital. Likewise, Return on Assets (ROA) rose significantly from 5.34% to 6.04%, representing a 13.19% increase, which shows that the company utilized its assets more efficiently to generate profit. Overall, the profitability ratios reveal that CAP Plc strengthened its earnings quality, improved operational efficiency, and maintained healthy returns for shareholders, positioning the company favorably for sustained financial growth.
Efficiency Ratios
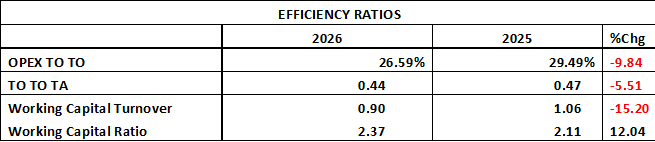
CAP Plc’s efficiency ratios present a mixed performance in the first quarter of 2026, reflecting improvements in cost management alongside slight declines in asset utilization efficiency. Operating Expenses to Turnover (OPEX to TO) ratio declined from 29.49% in 2025 to 26.59% in 2026, representing a 9.84% improvement. This indicates that the company managed its operating expenses more efficiently relative to revenue generation, contributing positively to profitability growth. The lower operating expense burden suggests stronger cost discipline and improved operational management during the year.
However, some efficiency indicators weakened slightly during the period. For example, Turnover to Total Assets ratio declined from 0.47x to 0.44x, while Working Capital Turnover reduced from 1.06x to 0.90x, indicating that the company generated slightly lower revenue relative to its asset base and working capital investment. Despite this, the Working Capital Ratio improved from 2.11x to 2.37x, reflecting stronger liquidity and improved ability to meet short-term obligations. Overall, CAP Plc maintained healthy operational efficiency with better expense control and stronger liquidity, although the slower asset turnover suggests there is still room to improve asset utilization and revenue generation efficiency.
Investment/Valuation Ratios
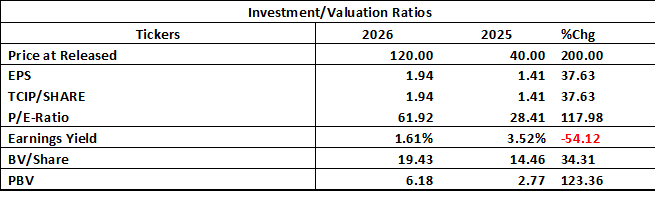
CAP Plc’s investment and valuation ratios improved significantly in 2026, reflecting the stronger market confidence and enhanced shareholder value. The company’s share price rose sharply from ₦40.00 in 2025 to ₦120.00 in 2026, representing a remarkable 200% increase. This substantial appreciation indicates strong investor sentiment toward the company’s growth prospects and profitability. Earnings Per Share (EPS) also increased by 37.63% from ₦1.41 to ₦1.94, while Total Comprehensive Income Per Share grew at the same rate, reflecting improved earnings attributable to shareholders.
The company’s valuation multiples expanded considerably during the year. The Price-to-Earnings (P/E) ratio increased from 28.41x to 61.92x, representing a 117.98% rise, which suggests that investors were willing to pay a significantly higher premium for CAP Plc’s earnings. Similarly, Price-to-Book Value (PBV) ratio advanced strongly from 2.77x to 6.18x, indicating improved market valuation relative to the company’s net asset base. In addition, Book Value per Share rose from ₦14.46 to ₦19.43, representing a 34.31% increase, supported by higher retained earnings and growth in shareholders’ equity.
Despite the strong market valuation, Earnings Yield declined from 3.52% to 1.61%, a 54.12% drop driven mainly by the rapid increase in share price relative to earnings growth, implying that the stock became more expensive from an earnings perspective. Nevertheless, the overall investment ratios portray CAP Plc as a high-growth and highly valued company with strong investor confidence, rising shareholder wealth, and solid long-term market prospects.
Investment Recommendations/Ratings
CAP Plc delivered a very strong financial performance in its 2026Q1 result, supported by double-digit revenue growth, improved operating efficiency, rising profitability, stronger liquidity, and a healthier balance sheet structure. The company recorded impressive growth in Profit Before Tax and Profit After Tax, while retained earnings and shareholders’ equity also expanded significantly. Solvency ratios improved as debt levels reduced relative to equity, indicating lower financial risk and stronger long-term stability. In addition, the company demonstrated efficient cost control, particularly in operating expenses, which further strengthened margins and overall earnings quality.
From an investment perspective, CAP Plc appears attractive for long-term investors seeking exposure to a fundamentally strong manufacturing and paints company. The sharp increase in share price and valuation ratios reflects strong investor confidence and positive market sentiment toward the company’s future prospects. However, the significant rise in P/E ratio and decline in earnings yield suggest that the stock may currently be trading at a premium valuation, meaning short-term upside could be somewhat limited unless earnings continue to grow strongly. Nevertheless, the company’s solid fundamentals, strong brand presence, improving financial health, and consistent profitability support positive long-term growth expectations.
Investment Rating: BUY (Long-Term Hold Bias)
Short-term investors: HOLD, due to elevated valuation and potential price volatility after strong price appreciation.
Long-term investors: BUY, based on strong earnings growth, improving solvency, healthy balance sheet, and strong market positioning.