Rating: Buy
Current Market Price: N4.70
Non-Performing Loan Ratio: 14.37%
Loan to Deposit Ratio: 53.43%
Year High: N7.70
Year Low: N3.60
Fair Value: N8.22
Equity Analyst: Tunde Segun Jeariogbe
Key Investment Ratios
• This report observed the full-year financial performance indices of FBN Holdings Plc as recently released by the management, we compared same with similar numbers released at the end of 2018 financial year to establish growth, projections and make recommendations accordingly.
• At the end of the 2019 business, session, the management proposed a 38 kobo cash dividend.
• The dividend is the same as 18.48% pay-out from the N2.06 earned per share during the year while yielding 9.50% of the current share price of FBNH on the Nigerian Stock Exchange (NSE) on the day the result was released to the investing public.
• Closure date for the dividend is April 21 and 22, 2020, while qualification and payment dates are April 20 and 28, respectively.
• We note that the bank did not meet the regulatory requirement for Loan to Debt Ratio (LDR). The bank only dispensed 53.43% of deposits received as loans in the period under review, lower than the regulatory minimum 65%.

Company Figures
• Gross Earnings through the year stood at N609.754 billion, same as 3.26% above the N590.518 billion posted in its 2018 full-year earnings.
• Interest Income improved by a marginal 1.61% at N444.556 billion, as against N435.563 billion in the corresponding year.
• Interest Expenses is currently valued at N152.342 billion, slightly above the N150.24 billion posted at the end of 2018.
• Operating Expenses is estimated at N280.531 billion, higher than N243.687 billion used through the prior year.
• Profit before Tax is estimated at N83.595 billion, versus N63.853 billion in the comparable year (2018).
• Having taken care of the Tax Expense, the management of FBNH posted N73.812 billion as profit for the year, which is 26.59% higher than the N58.309 billion reported in 2018.

• At the end of the 2019 financial year, the bank’s Total Assets is valued at N6.20 trillion, the same as 11.40% above the N5.56 trillion stated in its 2018 financial year-end.
• Total Liabilities equally stood above of the comparable year by 9.97% to N5.42 trillion, versus the N5.03 trillion reported in 2018.
• Net Assets is valued at N661.12 billion, as against N528.94 billion posted at the end of the corresponding year.
• Total Deposit received through 2019 is estimated at N4.88 trillion, this is 15.21% above N4.23 trillion in 2018.
• Total Loans and Advances of N2.60 trillion reported in 2019, which is only 2.90% higher than the N2.53 trillion posted in 2018.
• See the above table for details.
Financial Strength/Solvency Ratios
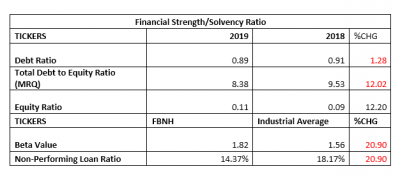
• Debt Ratio which compared Total Assets to Total Liabilities stood at 0.89x, implying that Total Liabilities is approximately 89% of Total Assets. Note that Total Liabilities is inclusive of Total Deposits for the year.
• Total Debt to Equity for the year stood at 8.38x, same as 12.02% which is below the 9.53x estimated in 2018. This implies that the company used 8.38 times of its equity through the period. Note that financial institutions use more debt since the collection of deposits is their major business.
• Equity Ratio which compares Equity to Total Assets stood at 0.11x, as against 0.09x implying that the reported Equity value at the end of the period is 11% of FBNH’s Total Assets. This was a 12.20% growth over the previous year’s estimate.
• Estimated Beta value for FBNH as at the time this report was compiled stood at 1.82, above market beta and also above the industry average as at the time this report was compiled.

Profitability Ratios
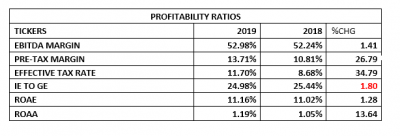
• EBITDA Margin is estimated at 52.98%, which is a marginal growth above the estimated 52.24% in the corresponding year.
• Pre-Tax Margin improved by 26.79% to 13.71%, as against the 10.81% estimated at the end of the 2018 financial year.
• Interest Expenses to Gross Earnings dropped by a marginal 1.80% to 24.98%, from the previously estimated 25.44%.
• Return on Average Equity through the year was 11.16%, from 11.02% in 2018.
• See the table below for detailed profitability ratios and comparison.

Efficiency Ratios
• Operating Expenses through the period rose above that of the corresponding year by 11.49%, shaving moved from 41.27% to 46.01%.
• Gross Earnings is the same as 9.83% of the Total Assets valuation at the end of the year, this is 7.31% below the 10.60% estimated in 2018.
• It was equally established that 53.43% of the total deposits for the period were granted as loan, representing a 10.69% drop from 59.82% of deposit reported in 2018 full-year, and lower than the 65% regulatory benchmark.

Investment/Valuation Ratios
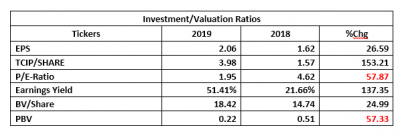
• At the end of the year, N2.06 was earned on each unit of FBNH, higher than the N1.62 earned per share at the end of 2018.
• The price of FBNH at the time this report was made available to the investing public can replicate the earnings per share 1.95 times (P/E-Ratio=1.95x) this is lower than the 4.62x estimated in 2018.
• The said earnings per share is a 51.41% yield of the price of FBNH on the exchange when the result was released to the investing public, this is a better yield when compared to 21.66% of 2018. Note that price dropped heavily as the market reacted to the outbreak and spread of the Coronavirus (COVID-19) pandemic.
• Estimated Book Value per shares of FBNH is currently N18.42, the same as 24.99% above the N14.74 of 2018.
• Thus Price to Book Value stood at 0.22x as against 0.51x. This simply implies that the stock is currently selling below its book value on the floor of the exchange.

Valuation
While trying to place a fair value on each unit of FBN-Holdings shares, we considered the average of two valuation models. FCFE Stable GrowthModel valued the stock at N11.02 while H-Model placed the price at N5.42. We, therefore, arrived at an average value of N8.22 for each share, thus, we Rated FBNH shares a BUY.


