
The Nigerian Exchange (NGX) experienced a strong recovery phase across key sectors. While the recovery phase is early, investors can position in fundamentally strong companies for the long run. This article should help investors choose a sector to focus on during this recovery phase
NGX ASI: Nigeria’s All-Share Index
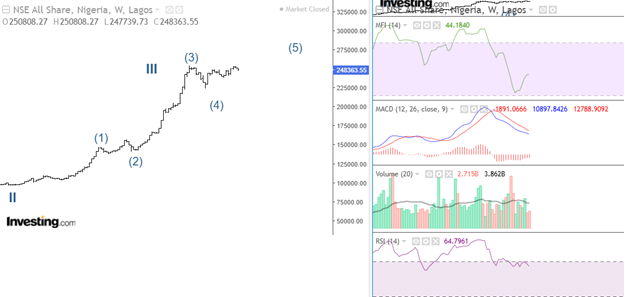
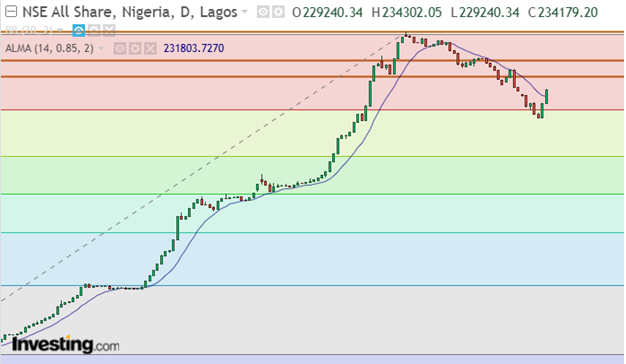
The NGX ASI closed above its moving average, gaining 2.15%. The index retraced to the 0.382 Fibonacci level and rebounded for an upward rally. This performance signifies that the market has started its recovery phase. Closing at 234,179.20 bps, investors should watch 238,689.70 bps — a potential resistance zone
Daily chart indicator analysis for NGX ASI
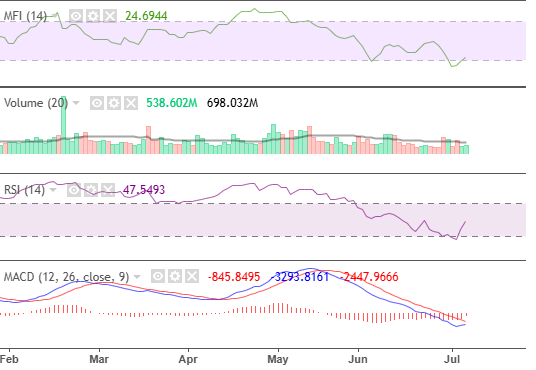
On the daily chart, the NGX ASI indicators signaled a recovering market. As MACD signals divergence, market liquidity and momentum gradually recover, preparing investors for a bullish market.
Key Sectoral Index Performance
NGXBNK: Banking Sector Index
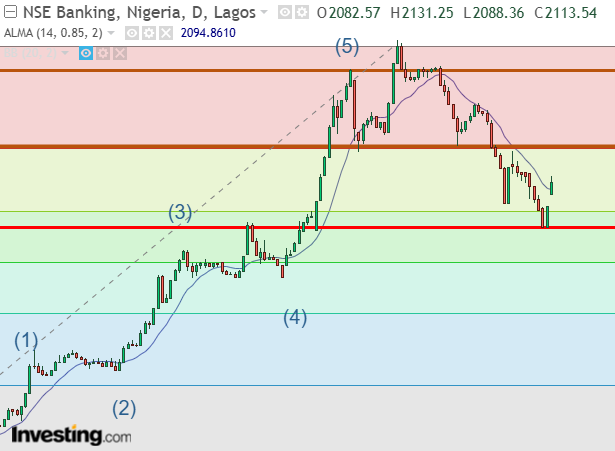
The NGXBNK gained 3.05% and closed at 2,113.54 bps. This performance followed a strong bullish move, with the top of wave three (1,994.32 bps) serving as strong support. Thus, investors should watch for 2,210.91 bps as a potential resistance level while the market recovers. Notable contributors included FIRSTHOLD (+10%), WEMABANK (+10%), GTCO (+4.84%), ACCESSCORP (+3.98%), and UBA (+3.41%).
Daily chart indicator analysis for NGXBNK
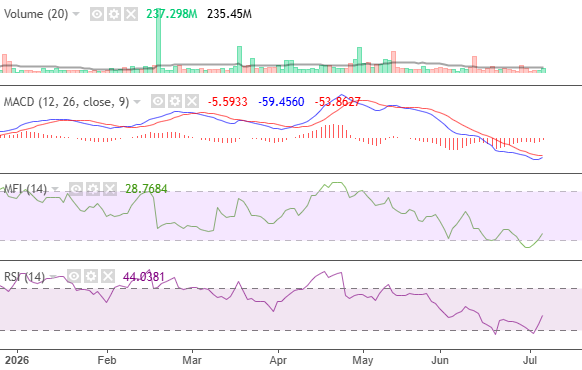
During intraday trading, the index experienced strong bullish momentum, creating a gap before closing above its moving average. In line with this performance, the index volume closed strongly above its moving average. Also, the market’s liquidity and momentum revived their strength, while MACD’s bearish momentum sustained its divergence phase. This means a bullish run is on the horizon.
NGXCSMG: Consumer Goods Sector Index
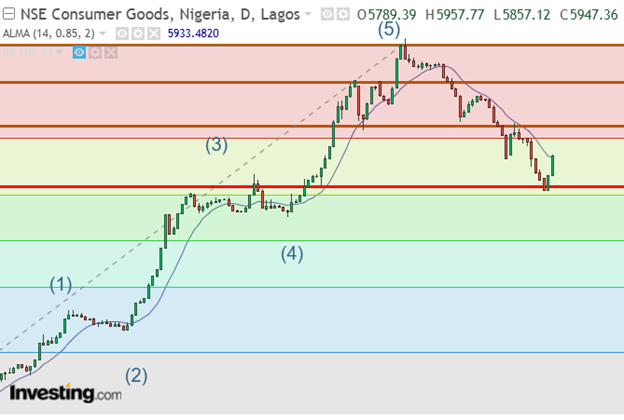
The consumer goods index gained 2.73%, closing at 5,947.36 bps. This performance portrays 5,696.43 bps as a strong support level, as the index closed above its moving average. Given this performance, investors should watch 6,096.53 bps, as that could be a potential resistance level. Notable gainers in this sector included NEIMETH (+9.76%), ROYALEX (+9.45%), and blue-chip banking companies.
Daily chart indicator analysis for NGXCSMG
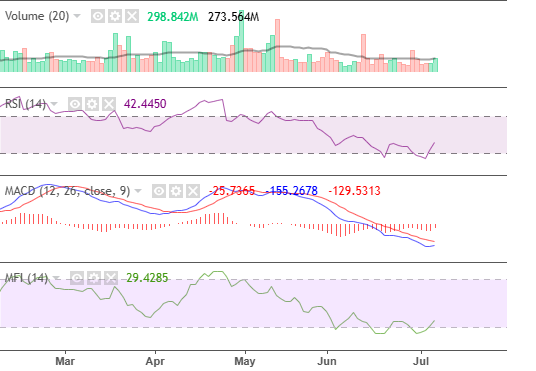
The bullish volume closed strongly above its moving average. Also, the market’s liquidity and momentum regained their strength, while MACD’s bearish momentum signaled divergence. These performances signal a quick market recovery as the market bulls take over.
NGXIND: Industrial Sector Index
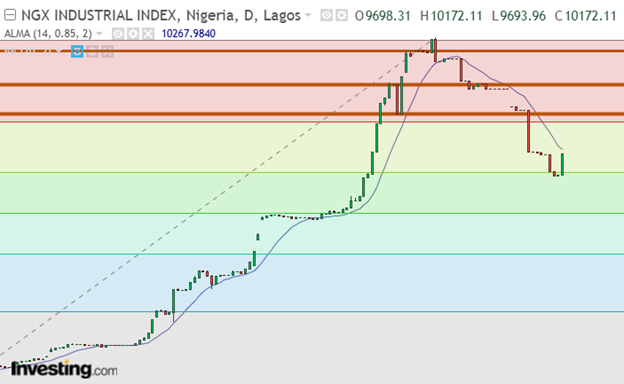
On the daily chart, the NGXIND gained 4.89% and closed at 10,172.11 bps. Although the index didn’t close above its moving average, the strong bullish sentiment suggests a recovery phase has started. Thus, technical investors would use further index actions to determine the strength of the index’s recovery phase. Notable contributors included 1 DANGCEM (+8.08%), WAPCO (+7.53%), and TRIPPLE (+7.32%)
Daily chart indicator analysis for NGXIND
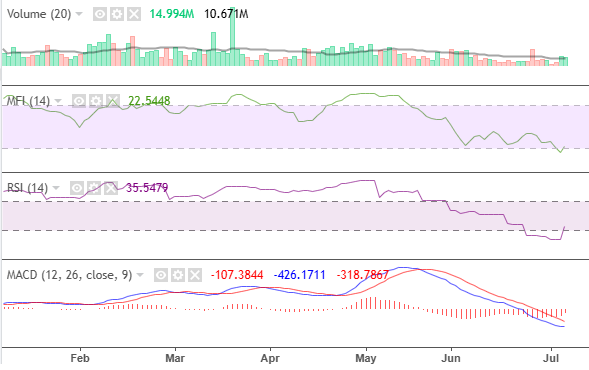
The indicators on the daily chart suggest a recovering market. The bullish volume closed strongly above its moving average. Also, the market’s liquidity and momentum tilt upward as MACD signals an upcoming trend reversal.
NGXOGSE: Oil and Gas Sector Index
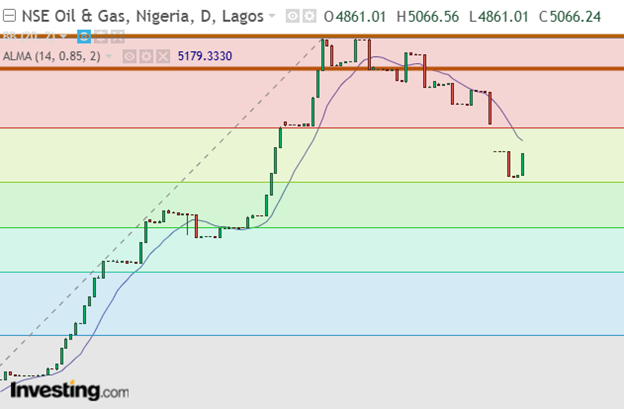
The oil and gas index gained 4.22% and closed at 5,066.24 bps. This performance suggests that investors increased their interest in this sector by buying into value. However, the index did not close above its moving average to confirm the strength of the phase.
Daily chart indicator analysis for NGXOGSE
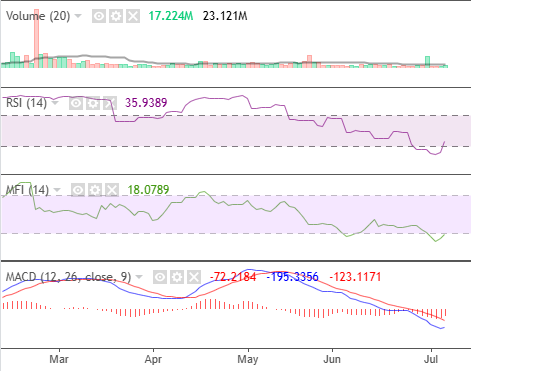
On the daily chart, the NGXOGSE indicators suggest a recovering market. Although the market’s volume, liquidity, and momentum are low, they closed with a positive sentiment. MACD also signals divergence, preparing investors for a bullish rally.
NGXINS: Insurance Sector Index
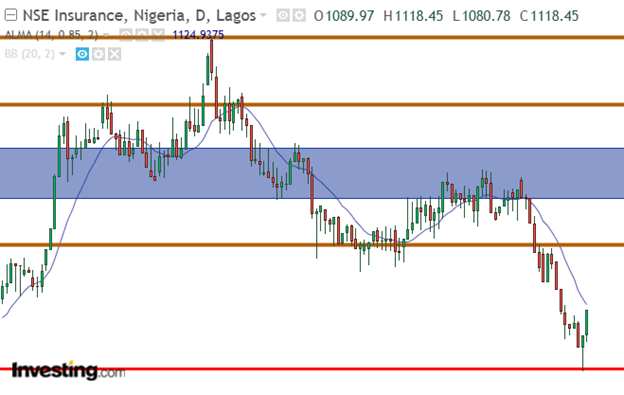
The insurance sector index closed with a bullish hammer candlestick pattern. This pattern in a downtrend usually indicates a potential bullish rally. The index gained 2.70%, closing at 1,118.45 bps. Notable contributors included VERITASKAP (+9.92%), CONHALLPLC (+9.59%), SOVRENI (+9.23%), MBENEFIT (+9.14%), and LASACO (+8.74%)
Daily chart indicator analysis for NGXINS
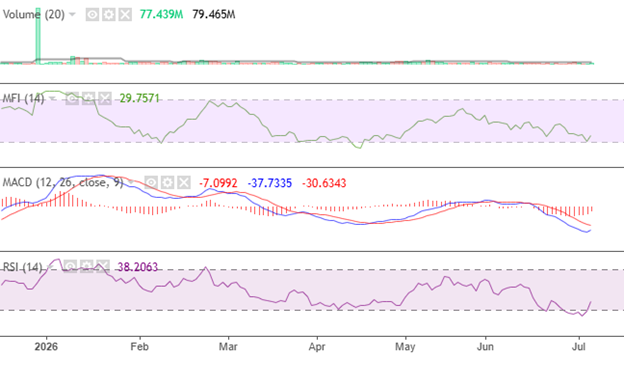
The index volume closed moderately strong below its moving average. In line with this performance, MACD signaled divergence as the market’s liquidity and momentum recover. Thus, retail investors can position in fundamentally sound companies.
FAQs
How did the NGXASI perform?
The NGXASI gained 2.15%, closing above its moving average
How did the NGX banking sector index perform?
The NGXBNK closed above its moving average, signaling a strong recovering market
How did the NGX consumer goods index perform?
The NGXCSMG also closed above its moving average, suggesting that the market has started its recovery phase
How did the NGX industrial sector index perform?
The NGXIND is recovering; however, it closed below its moving average
How did the NGX oil and gas sector index perform?
The NGXOGSE remains below its moving average. However, investors should watch for continuous bullish momentum
How did the NGX insurance sector index perform?
The NGXINS closed below its moving average, although it suggests that it’s recovering