
Okomu Oil Palm Company Plc is one of Nigeria’s largest integrated agro-industrial companies, specializing in the cultivation of oil palm and rubber, as well as the processing and marketing of crude palm oil (CPO), palm kernel products, and natural rubber. Established in 1976 by the Federal Government of Nigeria and privatized in 1990, the company is listed on the Nigerian Exchange (NGX) and majority-owned (62.94%) by Luxembourg-based Socfinaf S.A.
Current price: N1418
Rating: Buy
Price projection: N2260.56 and N2837.30
Technical Analysis
In this report, we shall use the following tools and analysis methods:
Elliott’s wave theory to understand the overall market sentiment
Fibonacci tools to determine support and resistance levels
The Relative Strength Index and volume to evaluate the market’s strength
The Money Flow Index to determine the market liquidity
Moving average and MACD to understand the nature of the trend
Top-down analysis to know the best investment position
Elliott wave analysis
Weekly chart: Market overview
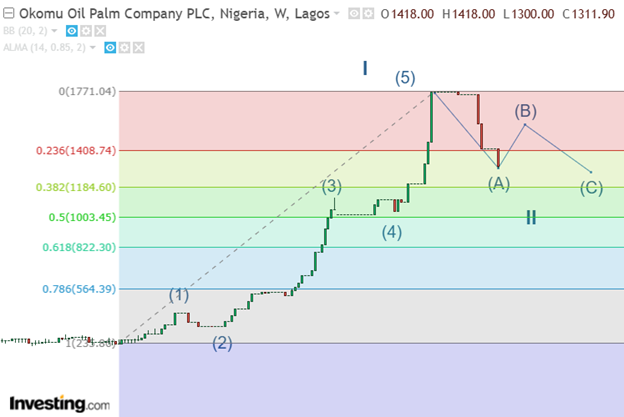
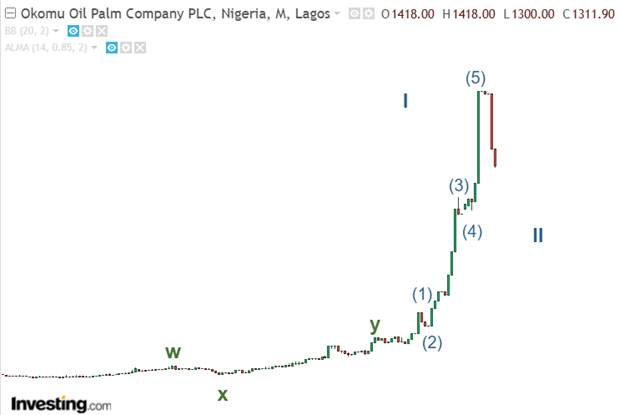
Okumu Oil is currently in its corrective phase of Wave II. Apply the Fibonacci tool, the price retraced to the 0.382 Fibonacci level, giving room for investment opportunities. Although investors should expect a bullish rally, understand the potential resistances for this rally is crucial.
Daily chart: Investment opportunity
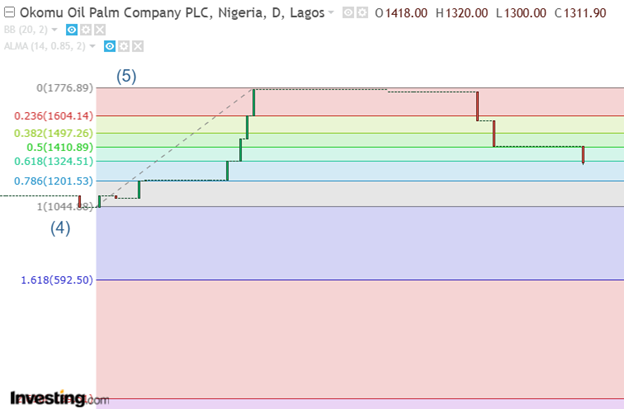
On the daily chart, Okomu Oil is approaching the 1.0 Fibonacci level. This performance suggests a potential market reverse. Those investors should watch N1200 and N1300 as potential support levels.
Indicator analysis
Weekly chart: Market overview
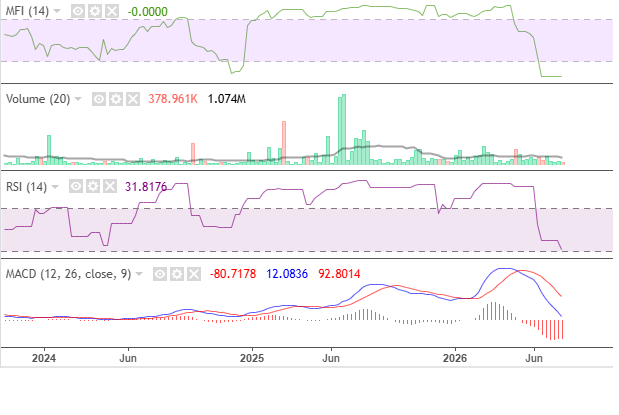
Despite the low volume, liquidity, and momentum, MACD’s bearish momentum sustained its divergence signal. This performance indicates that a potential bullish run is on the horizon. The price projections for Okomu include N2260.56 and N2837.30
Daily chart: Investment opportunity
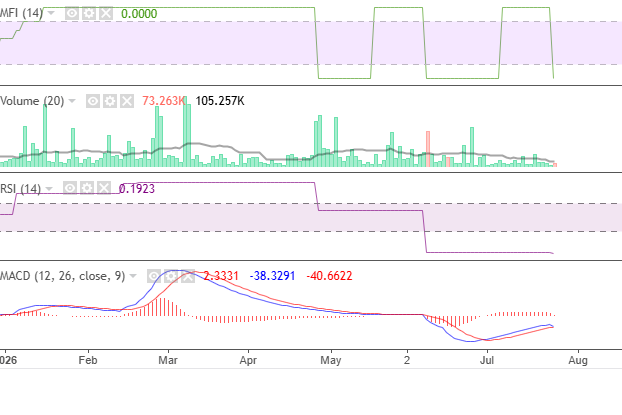
The volume, liquidity and momentum on the daily chart is low. Also, MACD’s bullish momentum signals divergence, preparing investors to buy into value. Thus, investors should check for strong support levels, which will sustain the bearish divergence on the weekly chart.
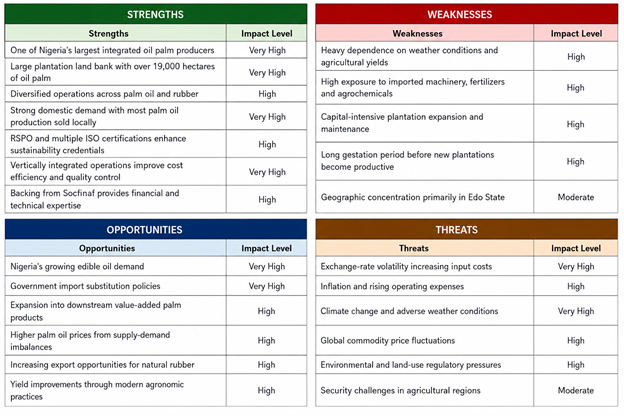
SWOT Analysis