

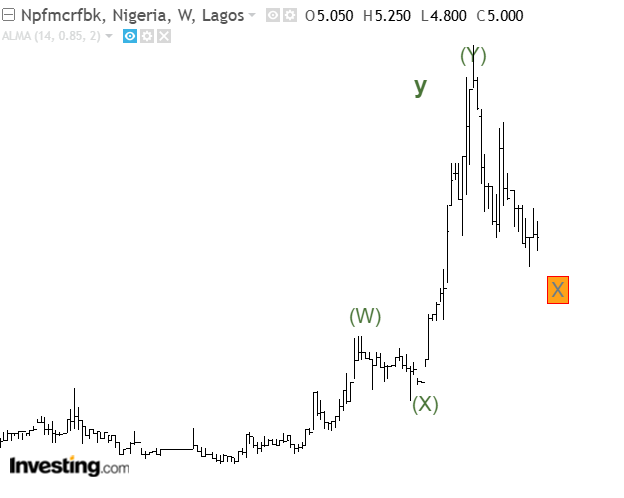
Current price: N5
Rating: Buy
Price projection: N8.5 (70%) and N10.8 (116%)
Technical Analysis
In this report, we shall use the following tools and analysis methods:
Elliott’s wave theory to understand the overall market sentiment
Fibonacci tools to determine support and resistance levels
The Relative Strength Index and volume to evaluate the market’s strength
The Money Flow Index to determine the market liquidity
Moving average and MACD to understand the nature of the trend
Top-down analysis to know the best investment position
Elliott wave analysis
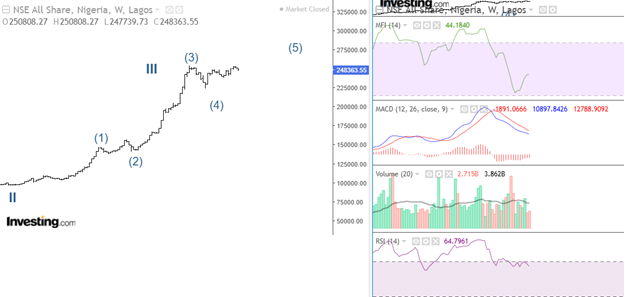
Weekly chart: Market overview
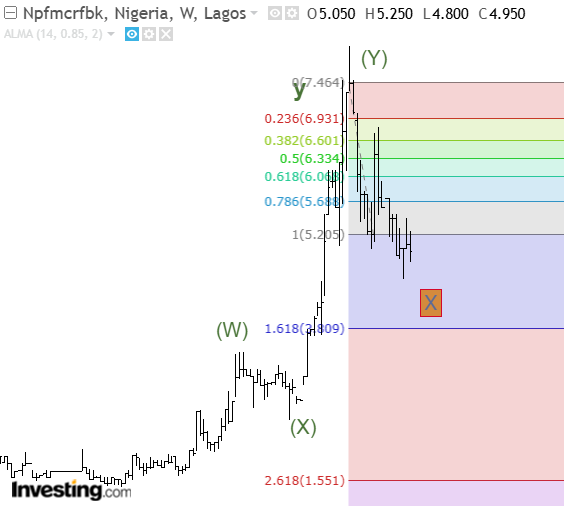
On the weekly chart, NPF should complete Wave X of the super grand cycle. After this corrective phase, the stock should commence a strong bullish phase (Wave Y of the super grand cycle). Plotting the Fibonnaci retracement, the corrective market retraced into the 1.618 Fibonacci sequence. This performance signals a potential upward rally
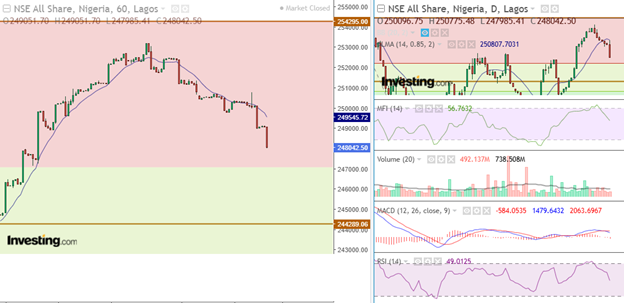
Daily chart: Investment opportunity
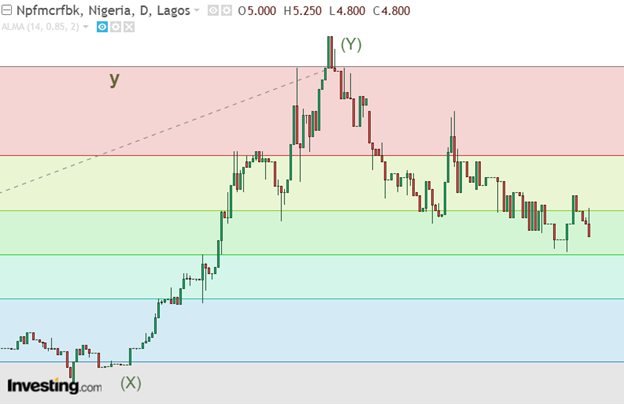
Plotting the Fibonacci retracement from the beginning and end of Wave Y of the grand cycle, investors should watch N4 and N5 as potential support zones. The price projections for this stock are N8.5 (70%) and N10.8 (116%).
Indicator analysis
Weekly chart: Market overview
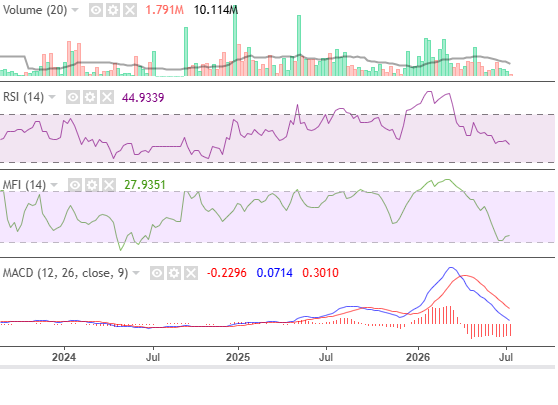
The indicators on the weekly chart signify that the stock is gradually recovering. Thus, investors must observe the support zones. MACD’s bearish momentum sustained its divergence signal as liquidity regains its strength.
Daily chart: Investment opportunity
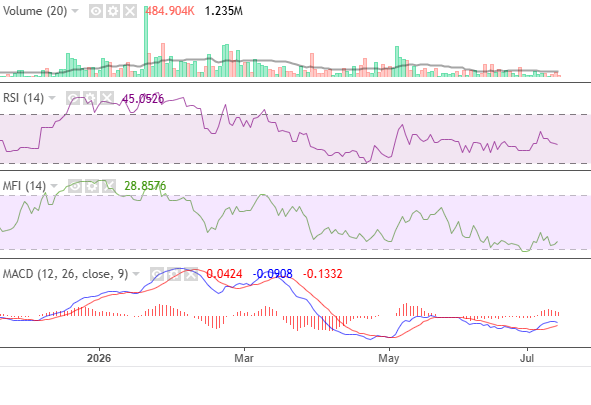
On the daily chart, NPF is also recovering. MACD is bullish as MFI tries to regain momentum. Although volume is low, RSI’s reading at 45.05 suggests that the market is relatively strong and has potential for an upward trend.
Fundamental Analysis
SWOT analysis