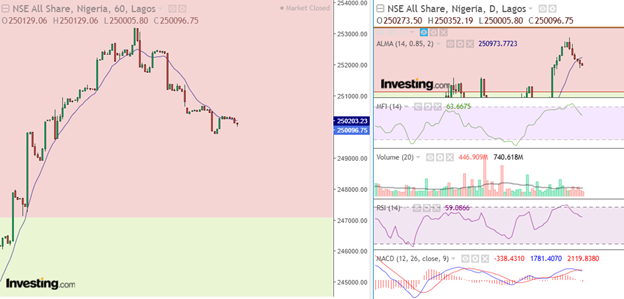

The Nigerian Exchange (NGX) experienced a strong recovery phase in the week ended 17 July 2026. Thus, this article should enlighten investors on which sectors to watch and their outlooks.
NGX ASI: Nigeria’s All-Share Index
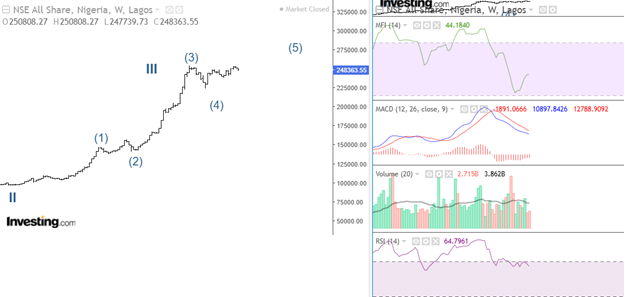
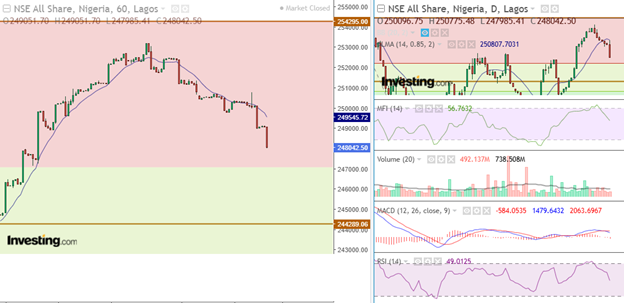
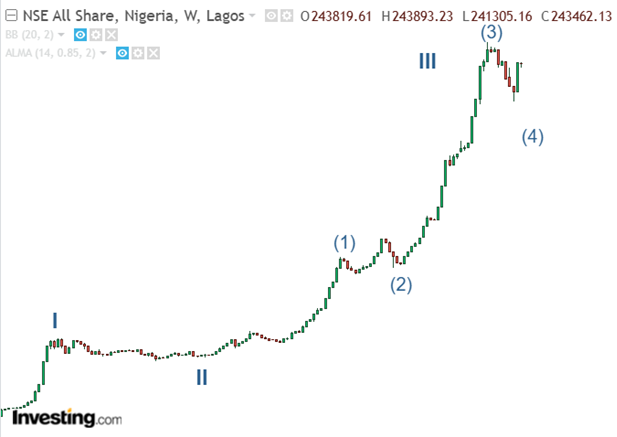
The NGX All-Share Index shed 0.2% despite the strong bullish sentiment from key sectors. Closing at 243,462.12 basis points, this index performance suggests a continuous bearish market.
Weekly chart indicator analysis for NGX ASI
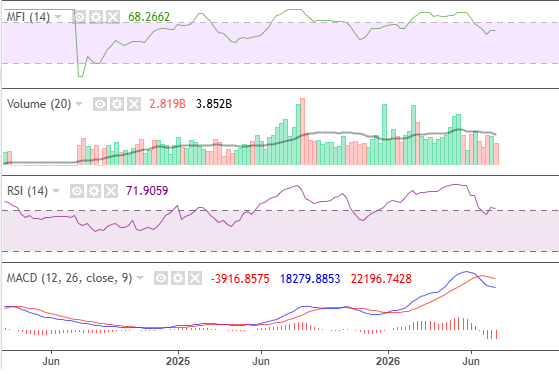
This bearish performance indicates profit-taking after a strong bearish momentum. The index liquidity and momentum remains strong, attracting move investment opportunities.
NGXBNK: Banking Sector Index
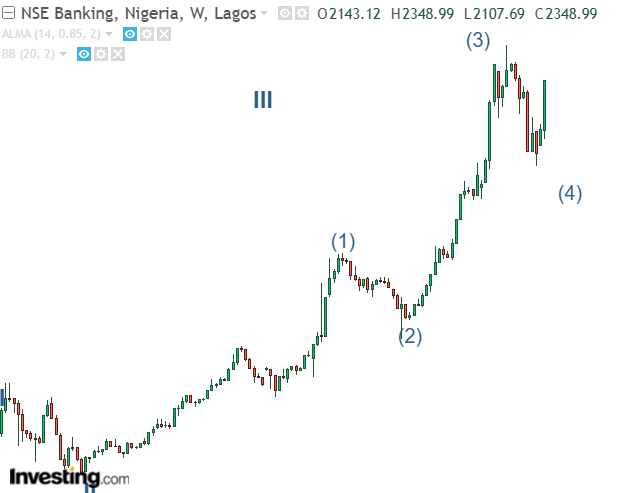
On the weekly chart, the banking index gained 9.30%, closing at 2,348.99 bps. During intraweek trading, the index experiences a strong bullish momentum within its fourth corrective wave. A continuous bullish rally would lead to a full market recovery for an impulsive fifth wave
Weekly chart indicator analysis for NGXBNK
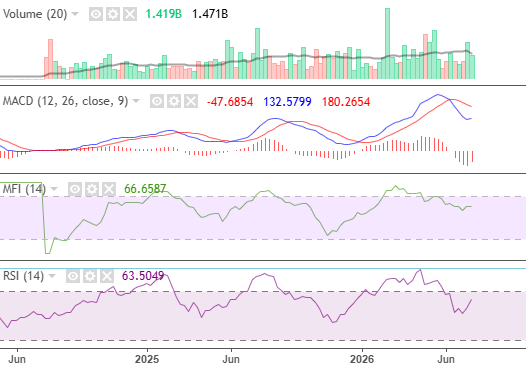
The strong bullish momentum on the weekly chart improved the index’s liquidity and momentum. This momentum also weakened MACD’s bearish signal, suggesting a strong market recovery
NGXCSMG: Consumer Goods Sector Index
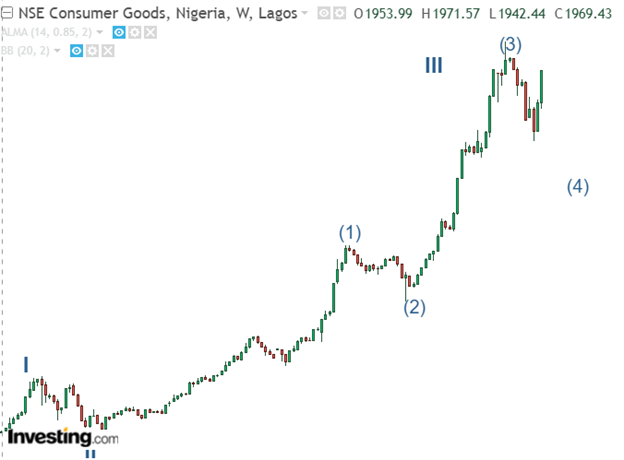
The consumer goods sector gained 6.65% and closed at 6,553.19 basis points. This performance signified a continuous market recovery. Although the index remains corrective with the fourth wave, a resistance breakout at 6,919.04 bps would suggest a full market recovery.
Weekly chart indicator analysis for NGXCSMG
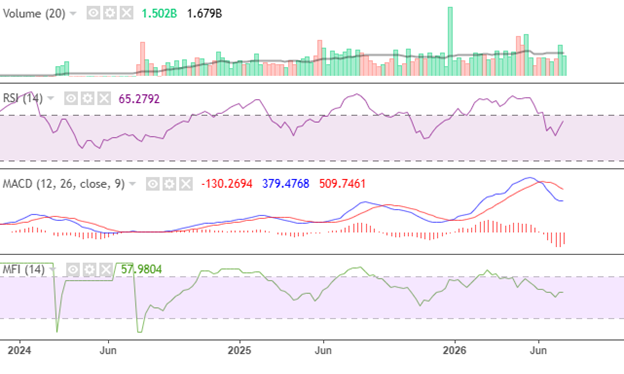
Following the strong bullish momentum, the NGXCSMG experienced improved liquidity and momentum. This sentiment also weakened MACD’s bearish signal, suggesting an upward rally.
NGXIND: Industrial Sector Index
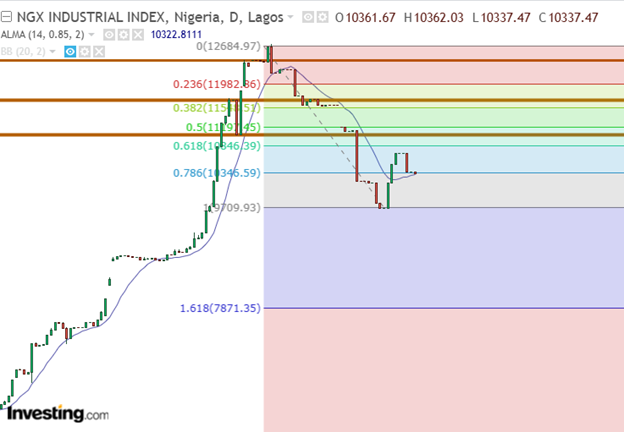
The industrial sector declined by 6.26% and closed at 10,042.21 bps. This performance suggests a continuous corrective fourth wave. During intraweek trading, investors took profits as sector rotation prevailed. Investing in value companies in this sector is a suitable strategy
Weekly chart indicator analysis for NGXIND
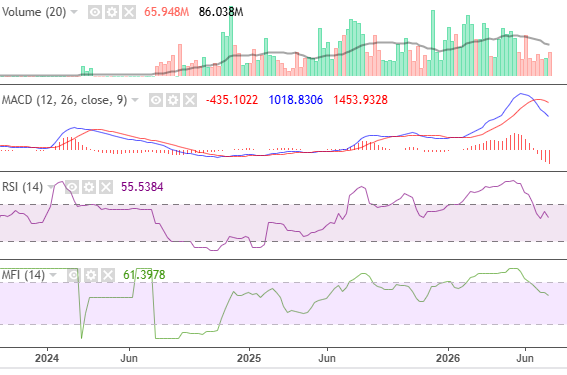
The index volume closed relatively strong, aligning with the bearish sentiment. Also, MACD’s bearish signal strengthened, suggesting a continuous bearish market. Despite the strong bearish momentum, the index’s liquidity and momentum remained solid.
NGXOGSE: Oil and Gas Sector Index
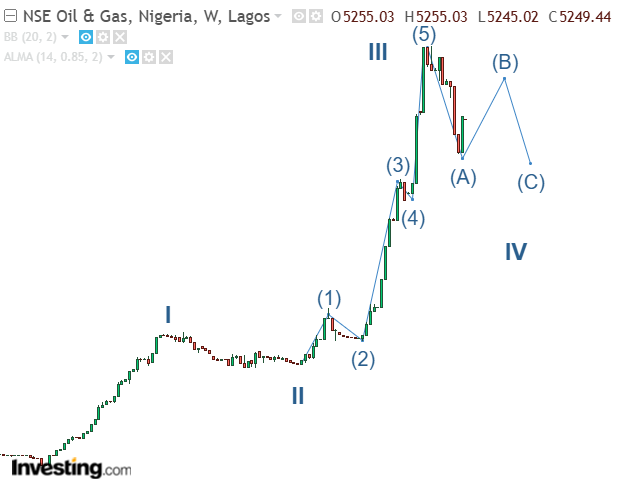
The oil and gas index shed 0.79% and closed at 5,249.44 bps. During intraweek trading, the market didn’t experience significant changes in basis points. This performance sustained the index’s corrective phase
Weekly chart indicator analysis for NGXOGSE
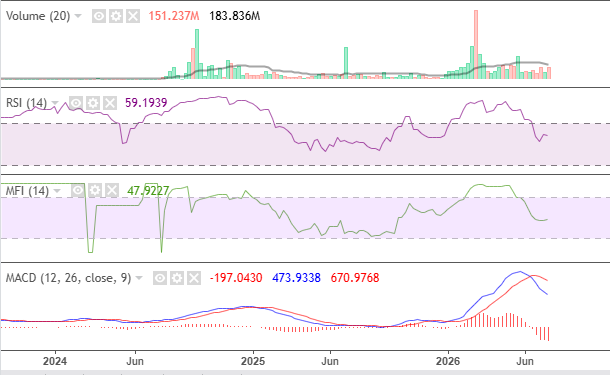
The weekly chart indicator readings of NGXOGSE suggest low investor interest in this sector. Despite the solid index momentum, volume and liquidity remained low. Also, MACD sustained a strong bearish signal
NGXINS: Insurance Sector Index
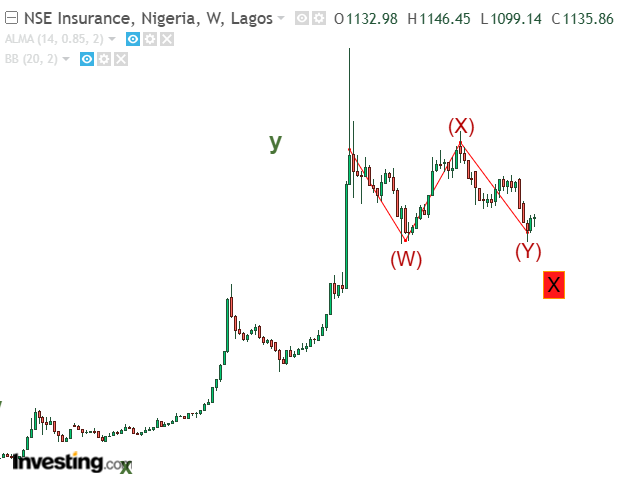
The insurance index experienced a fractional gain of 0.25%, closing at 1,135.86 bps. During intraweek trading, the insurance sector experienced a brief pullback and regained its bullish momentum. As the sector gradually recovers on the weekly chart, investors should note that it’s still in its strong corrective phase.
Weekly chart indicator analysis for NGXINS
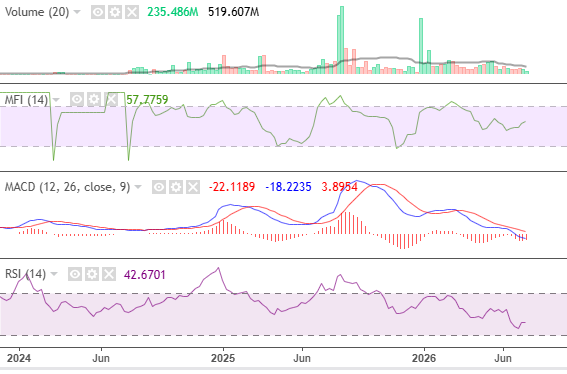
Although the index’s volume is low, its liquidity and momentum remained solid. Also, MACD’s bearish momentum suggests divergence. Investors should consider a long-term investment strategy for the insurance sector, as the index’s Wave Y can be a strong bullish momentum that surpasses its all-time high