
The Nigerian Exchange (NGX) remains in its corrective phase despite strong performance across key sectoral indices. This performance also aligns with each sector’s critical zone. This article should help investors understand the current market dynamic,
NGX ASI: Nigerian All-Share Index
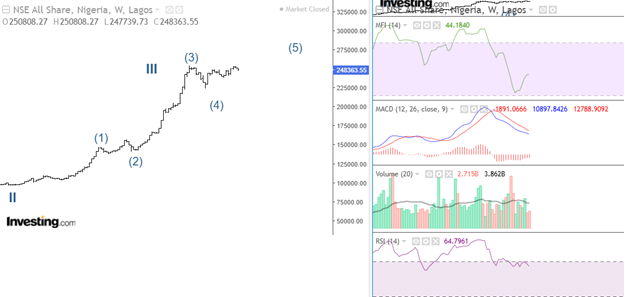
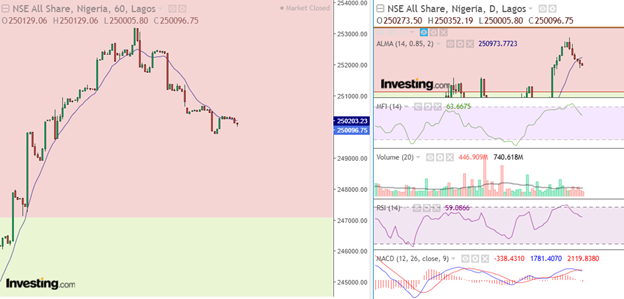
The NGX All-Share Index lost 0.51%, closing at 245,418.38 basis points. The index continues testing the 0.382 Fibonacci level. Thus, surpassing this level would ignite investors’ confidence in the market.
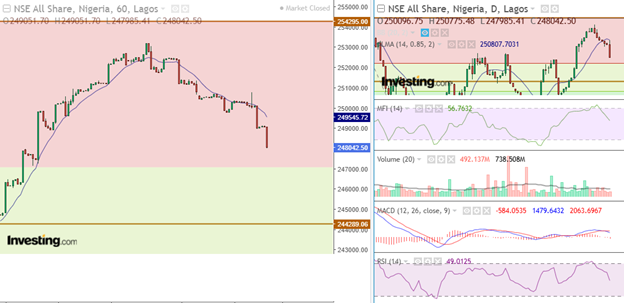
Daily chart indicator analysis for NGX ASI
Notably, MACD’s bullish momentum sustained its divergence signal amid strong liquidity and momentum. This performance aligns with profit-taking, and investors should be vigilant for a sustained bullish signal.
NGXBNK: Banking Sector Index
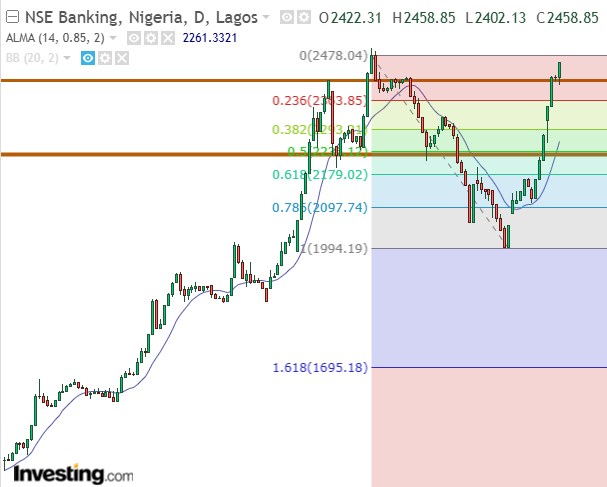
The banking sector index gained 1.51% and closed at 2,458.85 bps. During intraday trading, the index experienced strong bullish momentum amid profit-taking. This performance strengthened the index recovery phase. Notable contributors included FIRSTHOLD (+4.76%), WEMABANK (+3.23%), ZENITH (+2.72%), ACCESSCORP (+2.12%), and FCMB (+1.66%)
Daily chart indicator analysis for NGXBNK
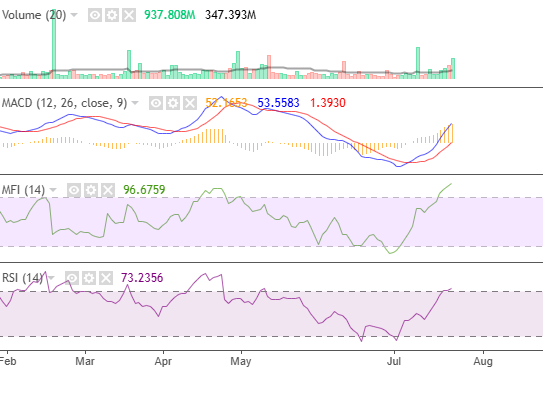
Volume closed strongly above its moving average with 937.8 million shares purchased. MACD’s bullish momentum increased from 49 to 52. Also, MFI and RSI increased, closing at 96.7 and 73.2, respectively. Based on these performances, the index’s recovery phase is strong. Also, a continuous bullish market should put the index in a fully recovered market phase.
NGXCSMG: Consumer Goods Sector Index
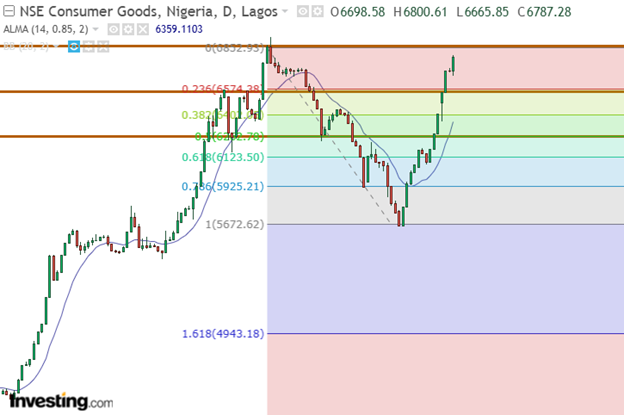
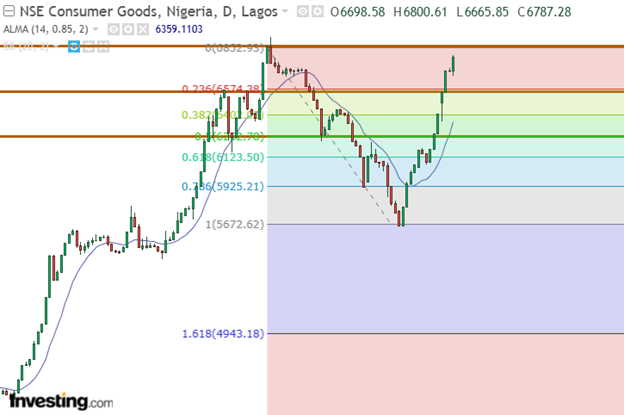
The NGXCSMG closed at 6,787.28 bps, gaining 1.23%. While the market bulls dominated, the index experienced profit-taking during intraday trading. This performance strengthened the index’s recovery phase. Notable contributors included UNILEVER (+10%), PZ (+6.19%), MANSARD (+5.42%), and HBMNG (+5.07%)
Daily chart indicator analysis for NGXCSMG
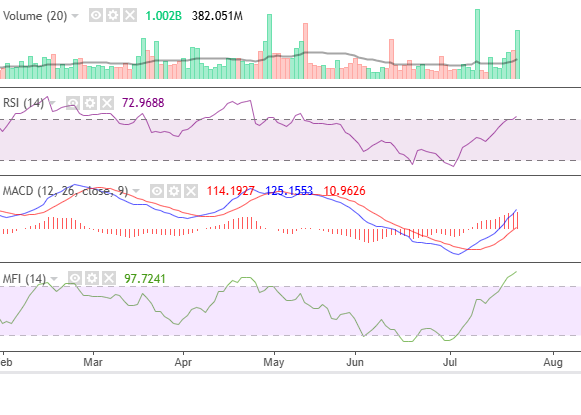
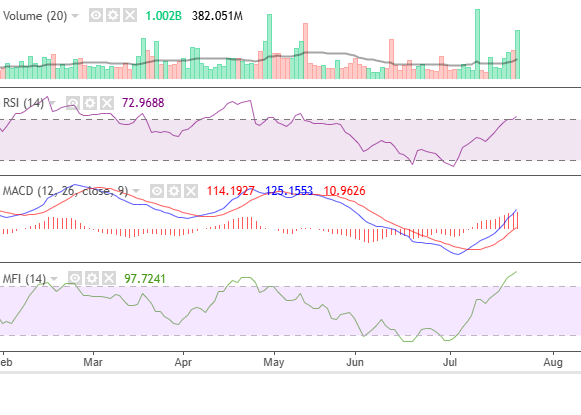
Volume closed strongly above its moving average with one billion shares purchased. MACD’s bullish momentum increased, closing at 114.19. Finally, MFI and RSI sustained their upward trajectory, closing at 97.72 and 72.96, respectively. This performance signifies a strong recovering market.
NGXIND: Industrial Sector Index
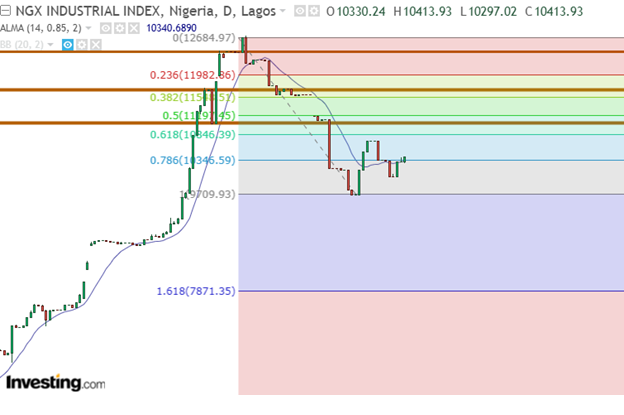
The industrial sector gained 0.81%, closing at 10,413.93 bps. During intraday trading, the index experienced profit-taking amid a bullish market. Notable gainers included HBMNG (+5.07%) and CUTIX (+3.57%)
Daily chart indicator analysis for NGXIND
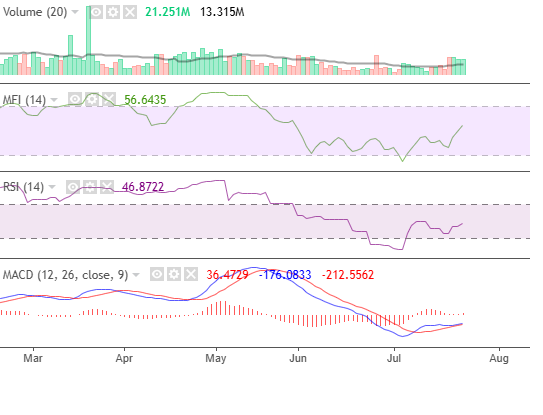
Volume closed strongly above its moving average with 21.3 million shares bought. Money flow and RSI closed at 56.6 and 46.9, respectively. Finally, MACD bullish momentum increased, closing at 36.47. These performances depict strong market recovery as the index’s momentum and liquidity improved with strong bullish volume.
NGXOGSE: Oil and Gas Sector Index
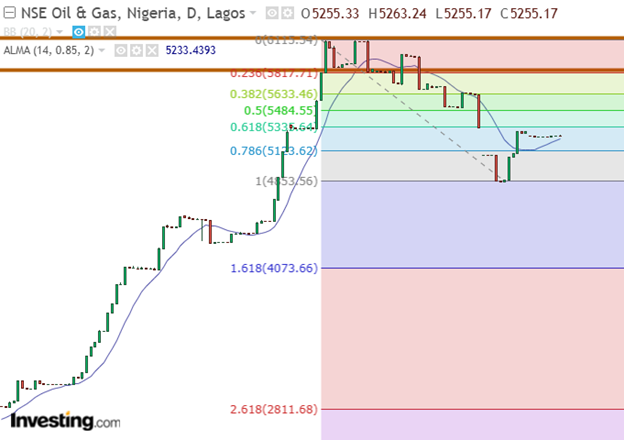
The oil index closed at 5,255.17 bps, closing with an indecisive bearish candlestick pattern. This performance usually signals a potential trend reversal. Thus, the index’s liquidity, volume, and momentum performance should determine the type of trend reversal.
Daily chart indicator analysis for NGXOGSE
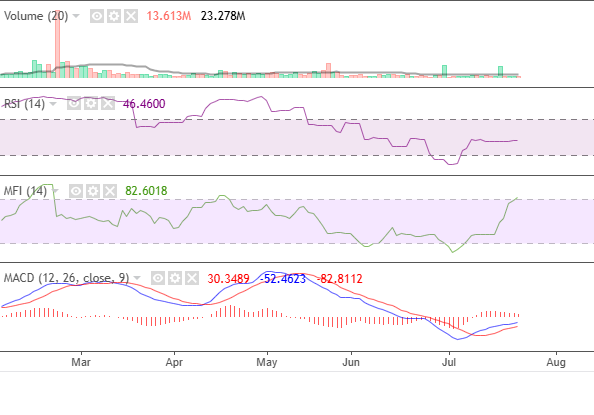
Volume closed low with 13.6 million shares sold. RSI remained flat, closing at 46. Money flow improved, closing at 82. Also, MACD’s bullish momentum declined, closing at 30.34. Although these performances are mixed, market analysts posit that investors are buying into value for long-term gains amid moderate index momentum.
NGXINS: Insurance Sector Index
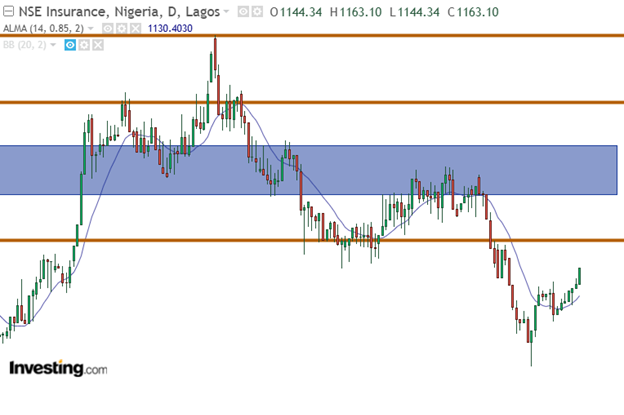
The insurance sector gained 1.64%, closing at 1,163.10 bps. The index closed with a 100% buy sentiment following an outstanding performance from insurance companies. During intraday trading, the index experienced profit-taking amid strong bullish sentiment. Notable contributors included MANSARD (+5.42%), WAPIC (+4.08%), MBENEFIT (+3.50%), NEM (+2.92%), and VERITASKAP (+2.55%)
Daily chart indicator analysis for NGXIND
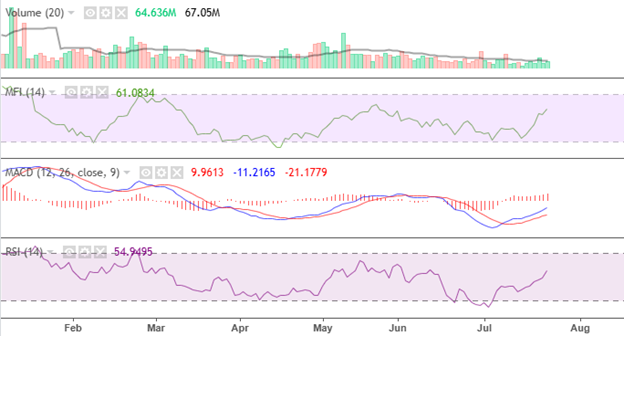
Volume remains solid, closing with 64.6 million shares purchased. MFI and RSI increased, closing at 61.08 and 54.95, respectively. Finally, MACD’s bullish momentum improved, closing at 9.9 from 8.3. These performances signal strong market recovery and favourable investment opportunities.
Market Analyst Insight
The banking and consumer goods sectors are displaying impressive performances despite being in critical zones. When these sector break their all-time high, a fully recovered market is on the horizon. Other sectors are still in their early recovery phase, offering investment opportunities.