

Cadbury Nigeria Plc is the Nigerian subsidiary of Mondelēz International one of the world’s largest snack and confectionery companies operating in over 150 countries. The business traces its roots in West Africa’s most populous country to the 1950s when it initially engaging in sourcing cocoa beans. Thereafter, it expanded into local manufacturing. Today, Cadbury Nigeria operates a manufacturing facility in Ikeja, Lagos and a cocoa processing plant in Ondo State, producing beverages, confectionery and intermediate cocoa products for the Nigerian market.
Current price: N57
Rating: Buy
Price projection: N96 and N120
Technical Analysis
In this report, we shall use the following tools and analysis methods:
Elliott’s wave theory to understand the overall market sentiment
Fibonacci tools to determine support and resistance levels
The Relative Strength Index and volume to evaluate the market’s strength
The Money Flow Index to determine the market liquidity
Moving average and MACD to understand the nature of the trend
Top-down analysis to know the best investment position
Elliott wave analysis
Weekly chart: Market overview
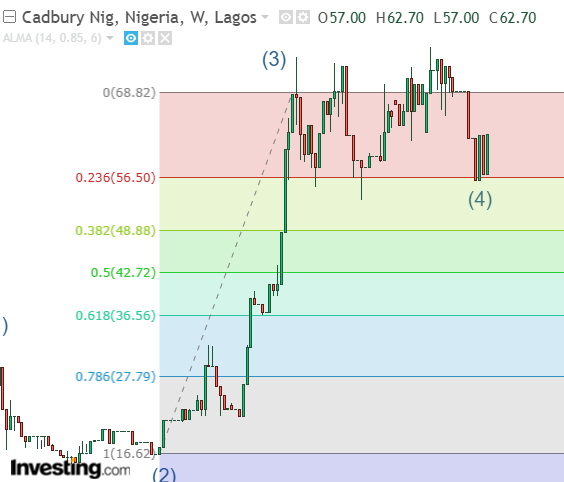
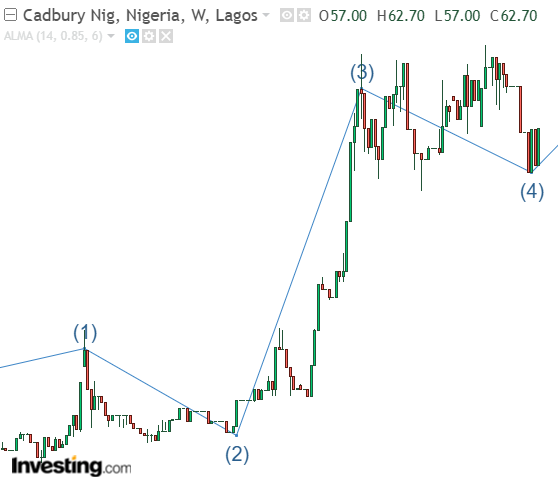
Cadbury is currently in its corrective phase. On the weekly chart, Cadbury experienced a strong bullish momentum after testing the 0.382 Fibonacci level. Following this sentiment, the price projections for this stock include N96 and N120.
Daily chart: Investment opportunity
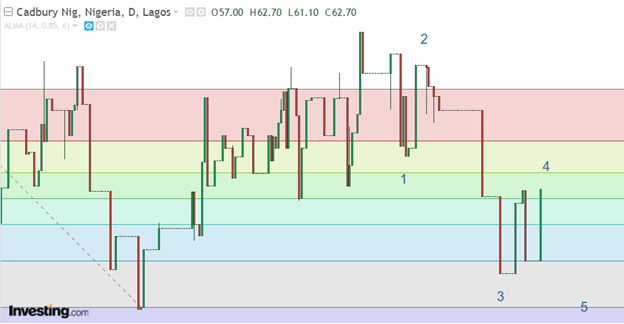
On the daily chart, the stock should complete its complex correction after wave five of the minor degree. Thus investing at a pullback is ideal. Additionally, investors should watch N53, N57, and N60 as strong support levels.
Indicator analysis
Weekly chart analysis: Market overview
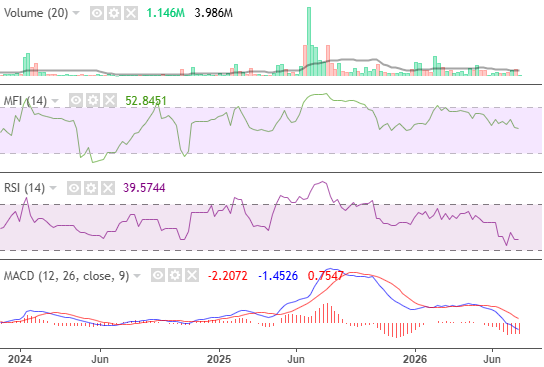
The liquidity on the weekly chart is strong, suggesting a healthy market. In line with this sentiment, MACD’s bearish remained stagnant. This performance indicates renewed investors interest as the stock prepares to a bullish run.
Daily chart analysis: Investment opportunity
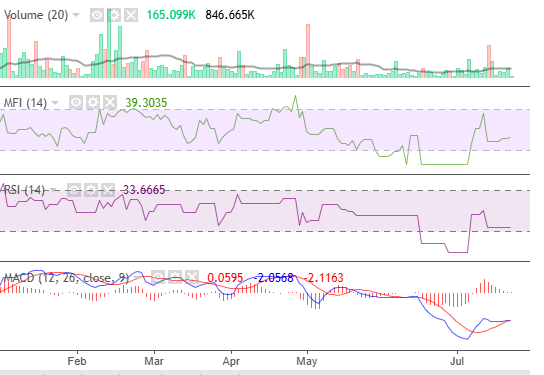
On the daily chart, the stock’s liquidity and momentum is low and slowly recovering. Also, MACD’s bullish signal is weakening, signal a potential bear market. This bear market offers investment opportunities for a better return on investment
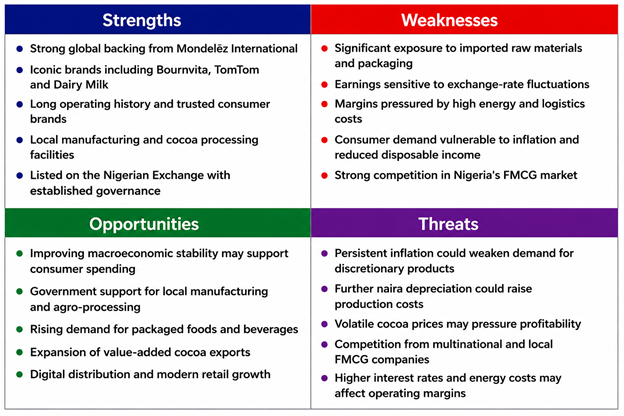
SWOT Analysis