
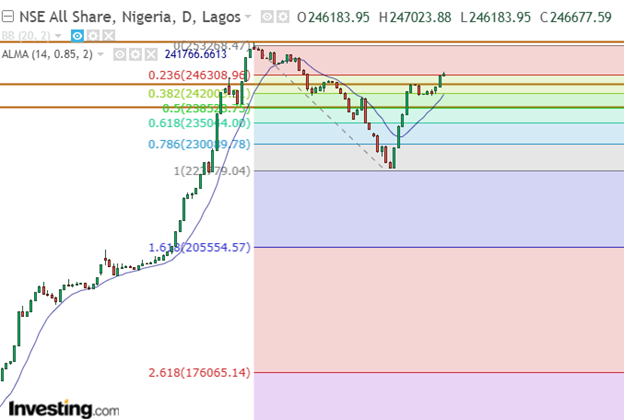
The Nigerian Exchange (NGX) has displayed a strong recovery phase in previous performances. However, the sentiment momentum gradually declined at vital market zones, as a result of which investors should know how to navigate this phase with this article.
NGX ASI: Nigeria’s All-Share Index
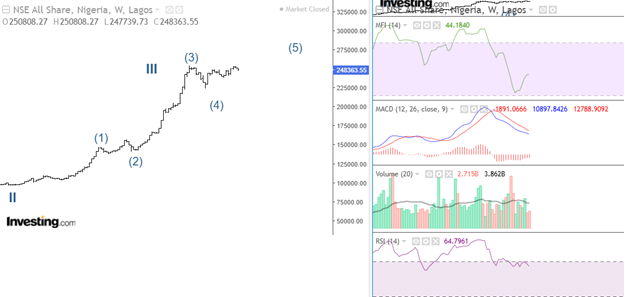
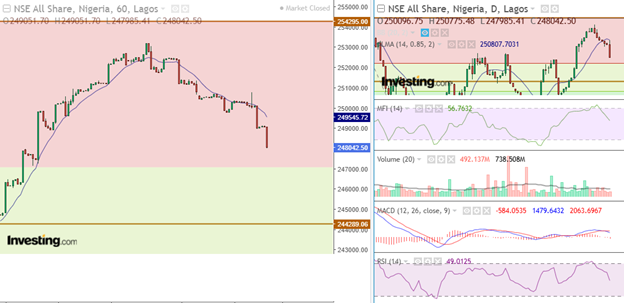
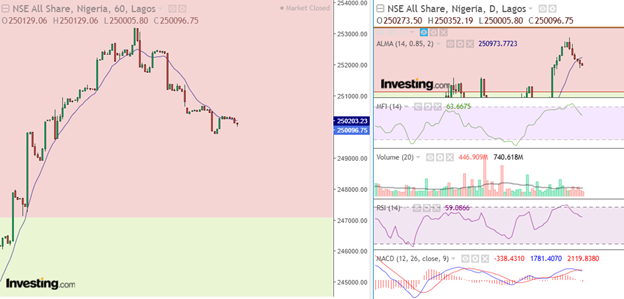
The NGX ASI gained 0.20%, closing at 246,677.60 basis points. This signals a continuous market recovery, although the index closed in a critical zone.
Daily chart indicator analysis for NGX ASI
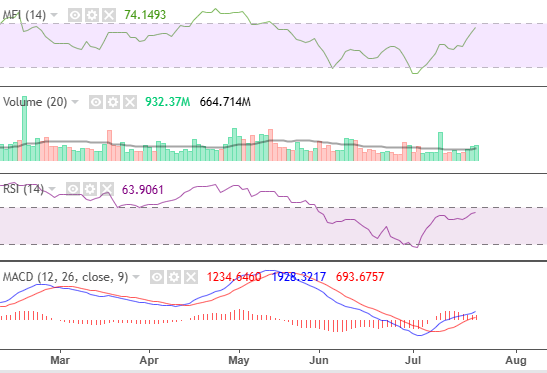
The index’s bullish volume, momentum, and liquidity remained strong. However, MACD’s bullish momentum sustained its divergence signal. This signals low buying interest and profit-taking across sectoral indices
NGXBNK: Banking Sector Index
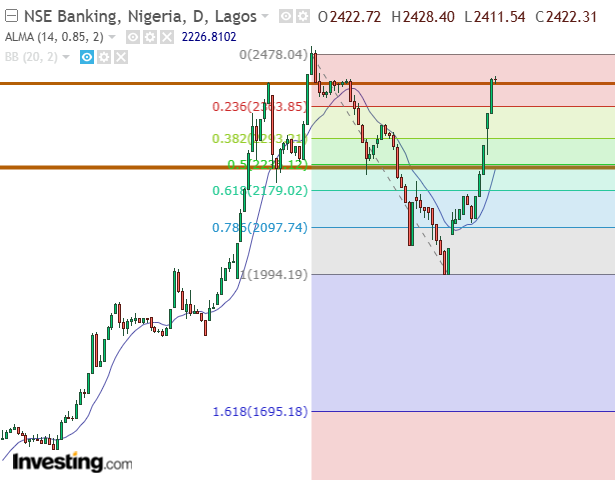
The banking index shed 0.02%, closing at 2,422.31 basis points. During intraday trading, investors took profits and bought into value. This performance also validates the strength of the index’s resistance zone between 2,478.04 bps and 2,363.85 bps. Notable contributors included UBA (-2.89%), FIDELITY (-0.92%), and FIRSTHOLD (-0.47%).
Daily chart indicator analysis for NGXBNK
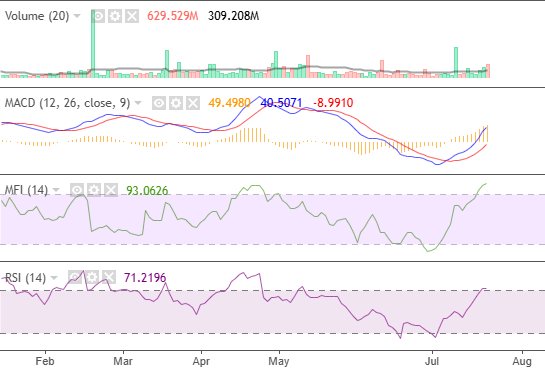
Volume closed strongly above its moving average, with 629.5 million shares sold. MACD’s bullish momentum increased from 45.8 to 49.4. Also, MFI and RSI closed at 93 and 71, respectively. These performances signal a sustainable and strong index recovery amid profit-taking.
NGXCSMG: Consumer Goods Sector Index
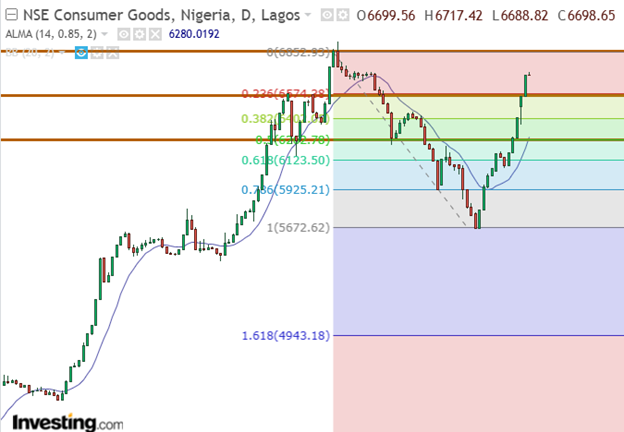
The consumer goods index experienced a fractional, subdued gain of 0.05%. Closing at 6,698.65 bps, the index opened bullishly and closed with a bearish candlestick above its previous close. Notable contributors included NEIMETH (+9.47%), MANSARD (+7.14%), CUSTODIAN (+3.36%), UCAP (+2.22%), and WAPIC (+2.08%)
Daily chart indicator analysis for NGXCSMG
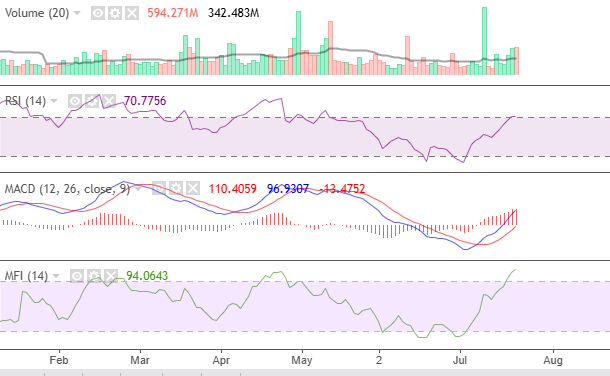
Volume closed strongly above its moving average, with 594.3 million shares sold. RSI and MFI increased, closing at 70.7 and 94, respectively. Also, MACD’s bullish momentum increased from 105.98 to 110.41. These performances indicate sustained investors’ interest in the sector amid profit-taking
NGXIND: Industrial Sector Index
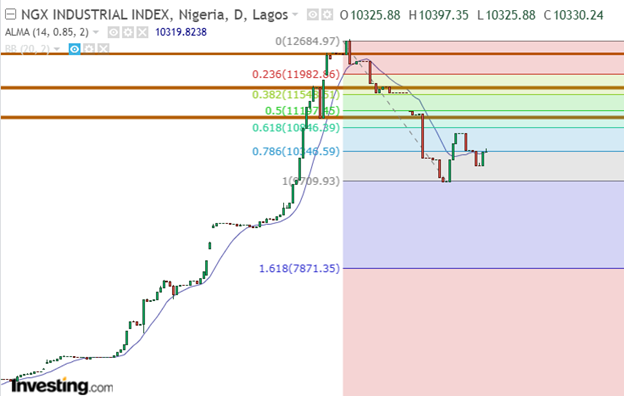
The industrial index experienced a fractional gain of 0.04%. During intraday trading, the index experienced strong bullish momentum. However, it closed with an indecisive bearish candlestick pattern. Despite this performance, the index closed above its moving average at 10,330.24 bps.
Daily chart indicator analysis for NGXIND
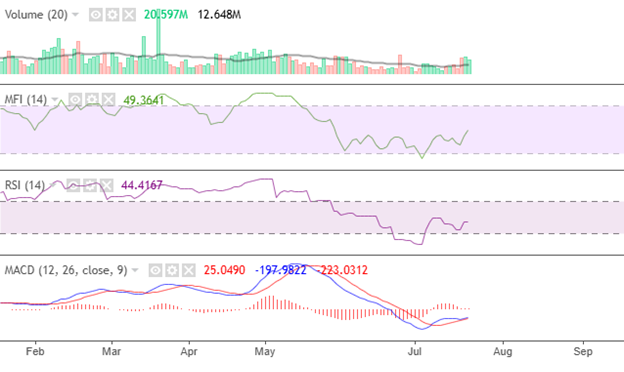
Volume closed strongly above its moving average, with 20.6 million shares bought. MFI and RSI closed at 49 and 44, respectively. Finally, MACD’s bullish momentum increased from 22 to 25. These performances indicate a continuously recovering market as liquidity and momentum improve gradually with strong volume.
NGXOGSE: Oil and Gas Sector Index
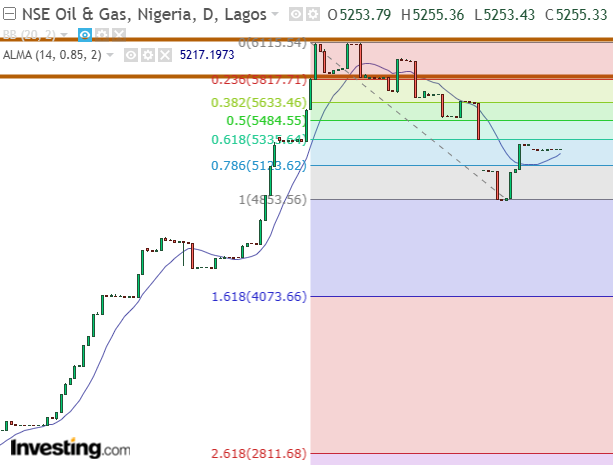
The oil index experienced a fractional gain of 0.03% and closed at 5,255.33 bps. Although the index did not make any significant changes during intraday trade, the market bulls dominated the market. This performance signals a continuous market recovery.
Daily chart indicator analysis for NGXOGSE
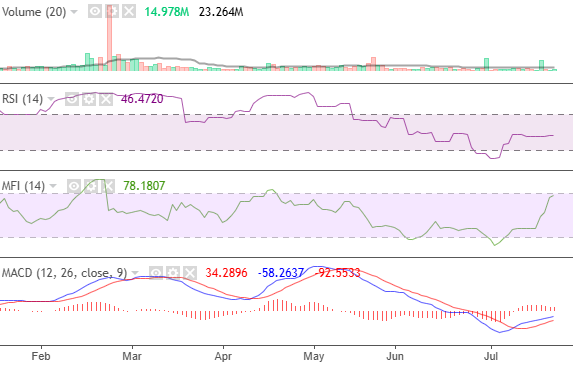
Volume closed below its moving average, with 15 million shares purchased. RSI and MFI closed at 46 and 78, respectively. Finally, MACD’s bullish momentum sustained its divergence signal. These performances show that investors are buying into value amid a corrective market. The strong index liquidity and solid momentum indicate a strong recovering market despite low volume.
NGXINS: Insurance Sector Index
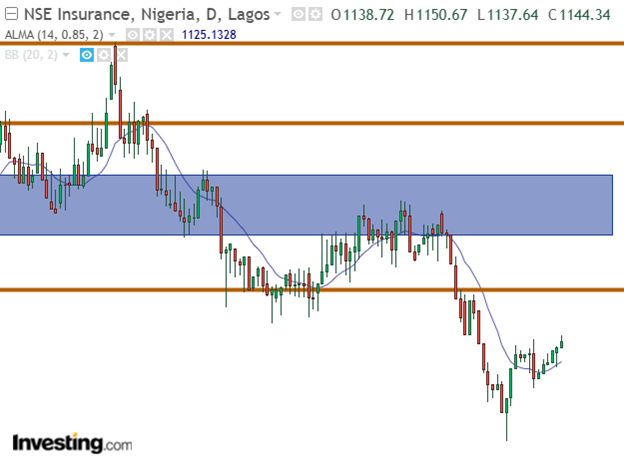
The insurance sector index gained 0.49%, closing at 1,144.34 bps. This performance sustained the index strength within its first recovery phase. Notable contributors included MANSARD (+7.14%), INTENEG (+4.05%), LASACO (+2.69%), REGALIN (+2.27%), and WAPIC (+2.08%).
Daily chart Indicator analysis for NGXINS
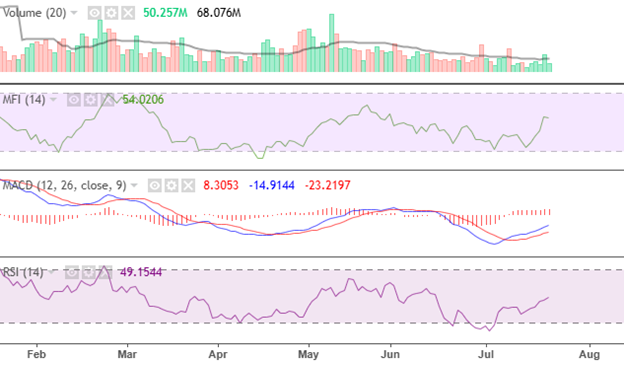
Volume closed below its moving average with 503 million shares purchased. MFI declined, closing at 54, while RSI increased its momentum, closing at 49. Also, MACD’s bullish momentum increased from 7.6 to 8.3. These performances indicate a sustainable recovering market with solid volume, liquidity, and momentum.
Market Analyst Insight
When a market experiences fractional gains, it signals that a trend reversal is on the horizon. To analyze this market, investors can use Fibonacci tools to understand the critical market positions.
Currently, the banking and consumer goods sectors are in critical resistance zones and show signs of market exhaustion. Other sectors, such as industrial and oil, also closed with fractional gains; however, it’s expected that the index continues its recovery above the moving average to the 0.5 Fibonacci level. In general, the market remains corrective until it surpasses its previous all-time high.