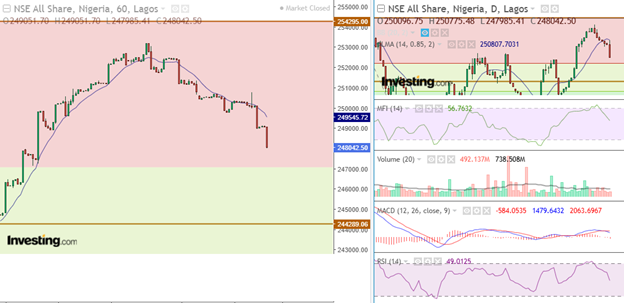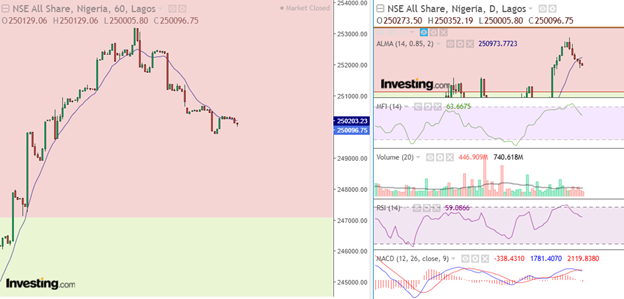

The Nigerian equities’ market experienced a strong consolidation phase in the month of May, arising from the strong markup in April.
Similarly, selective bargain hunting and profit-taking in blue-chip companies occurred during the period. This monthly report will, therefore, use the grand Elliott wave cycle to help investors understand the bigger picture of the bourse’s performance.
Nigeria’s All-Share Monthly Performance for May 2026
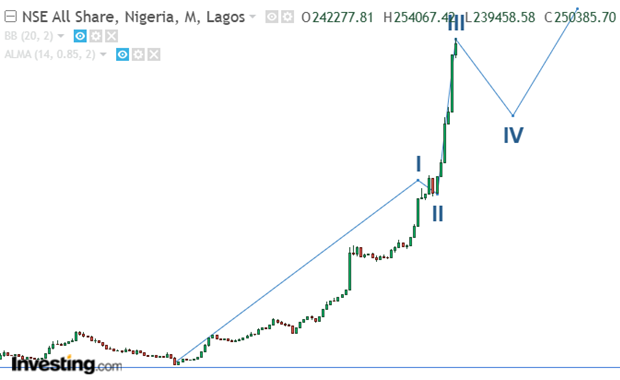
Cumulatively, the composite All-Share Index of the Nigerian Exchange (NGXASI) gained 3.81%, closing the month at 250,385.70 basis points above its moving average. The index continued to sustain its strength and resilience amid the distribution phase in the intra-month market. This performance also validates the strength of the Nigerian bourse as more investors flock to the market in search as it offers significantly better returns or yield than any other financial market instrument available today.
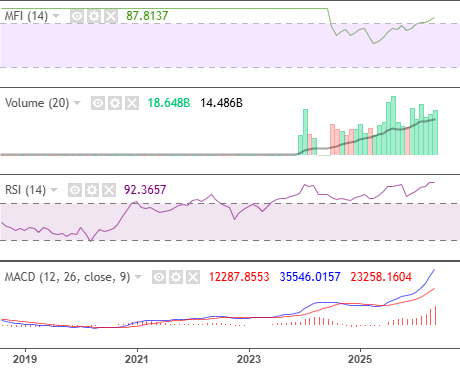
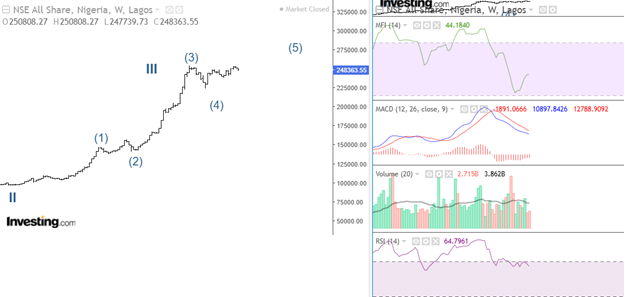
On the weekly chart, the bullish volume remained solid, following which market momentum and liquidity remained strong over their threshold holds. This action gives investors the needed confidence to participate in key sectors of the market. Since the index is in its third wave, it’s expected to extend its bullish performance going forward.
How did the sectors perform in May?
Key Sectoral Index Performance for May 2026
NGXBNK: Banking Sector Index
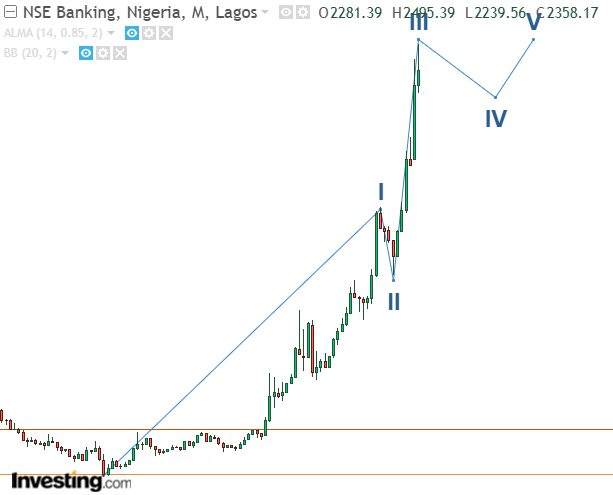
The NGXBNK monthly chart remains strongly bullish, despite the overall bearish sentiment. The index gained 3.91%, closing at 2,363.05 bps above its moving average. This bullish performance was less than those of its predecessors due to the distribution phase in the intra-month market.
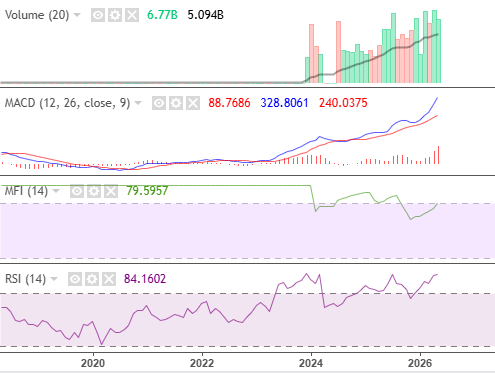
The monthly chart indicators for the NGXBNK sustained their bullish signals. Each indicator closed above its threshold, signalling strong market liquidity and momentum. In line with this performance, the index offers favourable investment opportunities for long-term market participants.
NGXCSMG: Consumer Goods Sector Index
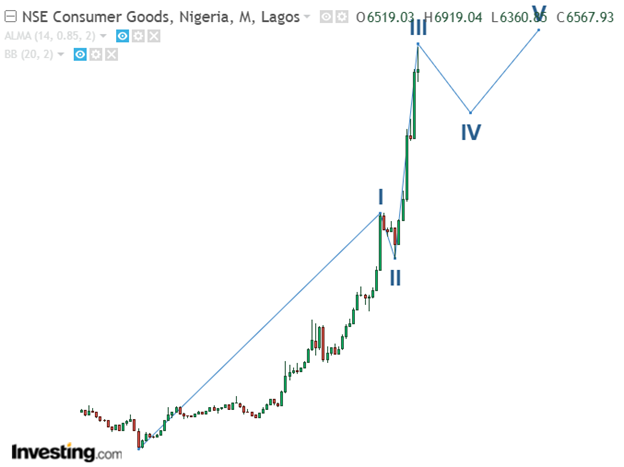
The consumer goods index gained 1.10% on the monthly chart, closing at 6,567.93 bps. On the grand cycle, the index is in wave three of the Elliott wave, which is expected to extend to 1.618 of the Fibonacci sequence. Thus, the bullish rally should continue above its moving average.
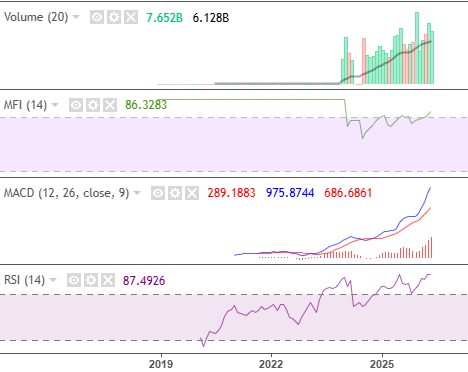
During the intra-month market, the index experienced selective bargain hunting and massive profit-taking. Given this performance, the bullish volume didn’t exceed its predecessor. However, the indicators on the monthly signals strong market volume, liquidity, and momentum.
NGXIND: Industrial Sector Index
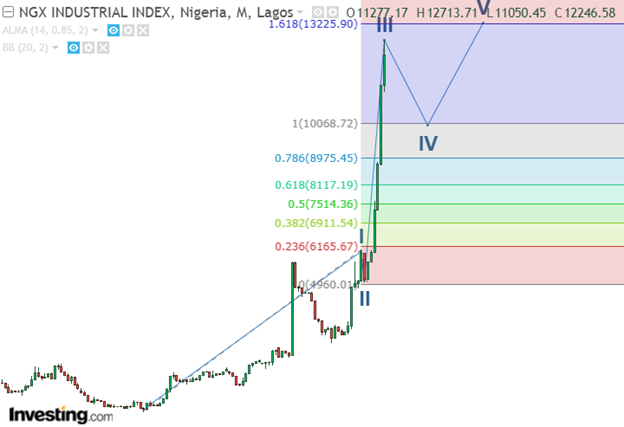
The NGXIND gained 8.44% on the monthly chart, closing at 12,246.58 bps. The index experienced a significant markup phase while other sectors consolidated. This performance reflects the sustained investor confidence in the sector. In line with this sentiment, the sector should surpass its 1.618 of the Fibonacci sequence.
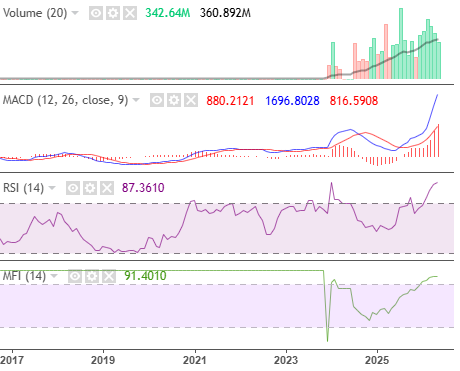
Despite the strong bullish sentiment on the monthly chart, the bullish volume was moderately strong, closing below its moving average. This action occurred due to constant profit-taking and portfolio rebalancing. Regardless, other indicators signalled strong market liquidity and momentum.
NGXOGSE: Oil and Gas Sector Index
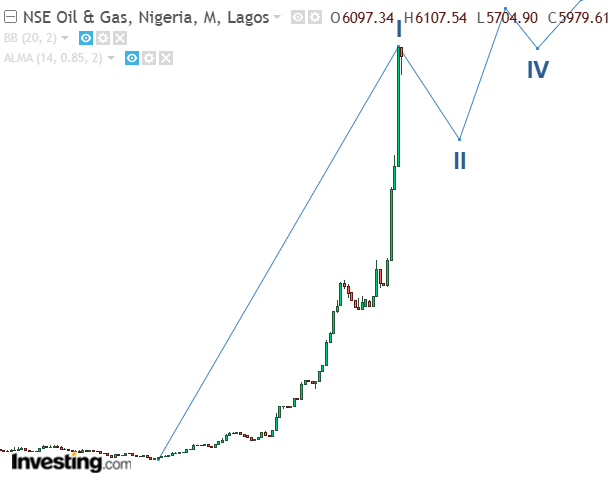
The oil index lost 2.02% on the monthly chart, closing at 5,979.61 bps. On the grand cycle of the Elliott wave theory, the NGXOGSE is at the peak of its first wave. This performance is usually followed by a pullback that corrects the market. The oil sector has remained resilient on the monthly chart, closing above its moving average.
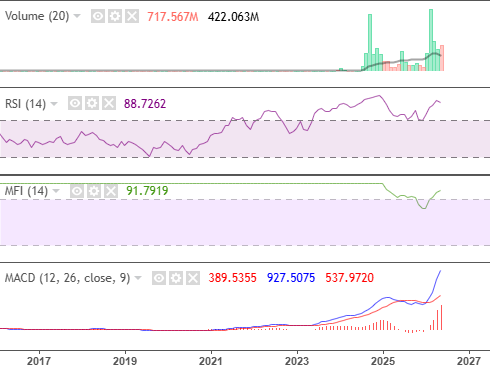
The bearish volume closed strongly above its moving average, indicating strong profit-taking. Also, the index briefly lost momentum, aligning with the bearish sentiment. However, the market’s momentum and liquidity remain solid for investment.
NGXINS: Insurance Sector Index
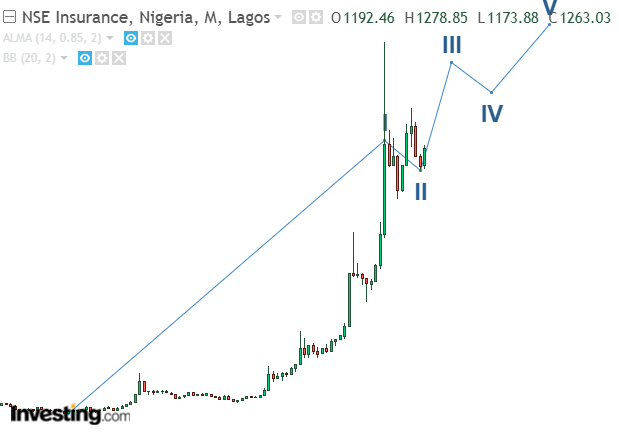
The insurance sector gained 5.99%, closing at 1,263.03 bps above its moving average. The index closed with a bullish engulfing candlestick. This candlestick pattern usually indicates that a potential bullish rally is on the horizon. The intra-month market showcased a promising performance after breaking its resistance zones and trading above its moving average.
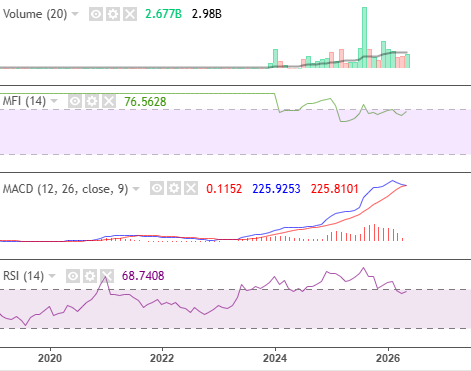
The NGXINS indicators on the monthly chart maintained a solid performance, as the market liquidity and momentum increased. On the other hand, MACD’s bullish signal still reflects divergence, as the bullish volume was moderately strong. Given the sentiment during the intra-month market, the indicators should align for an upcoming bullish rally.
Final Thought
While the key sectors experienced consolidation throughout May, the market remained solid and resislient above its moving above its moving average. The sector that stood out in May was the insurance sector as investors indulged in portfolio rebalancing.