Company: Julius Berger Nigeria Plc
Rating:
Short Term:Buy
Long Term: Buy
Current Market Price: N22.50
Latest Cash Dividend: N2.00
Year High: N22.50
Year Low: N19.90
Fair Value: N28.64
Equity Analyst: Tunde Segun Jeariogbe
Introduction
• In line with the new Securities & Exchange Commission rule, the management of Julius Berger released its unaudited full-year financials for the year ended 31st December 2019. Hopefully, the dividend notification will be released after the result is audited and approved.
• This report, therefore, observes and compares this result with audited numbers from the corresponding full-year of 2018 to establish a pattern. The valuation was established relying on estimates from the numbers and previous projections.
• Generally, the result revealed improved performances and the management’s conservative business strategies. We are of the opinion that the company’s numbers immensely benefitted from the various road construction works across the country.
Statement of Comprehensive Income
• Turnover for the period under review improved over that of the comparable year by 35.94% to N264.55 billion, as against N194.61 billion.
• The cost of Sales maintained the same rate as the figure proportionally improved to N203.88 billion, versus N142.60 billion in the 2018 full year.
• Operating Profit is estimated at N20.52 billion, a 42.73% improvement over the N14.37 billion achieved in the 2018 operating period.
• Operating Expenses for the year were valued at N35.48 billion, a mild increase over the N34.59 billion of the prior year. Please note that the mild improvement in expenses is despite the outstanding growth in the Turnover.
• Finance Cost used through the period grew by 43.08% to N6.52 billion, from N4.56 billion in the corresponding year.
• Profit before Tax is currently valued at N14.68 billion, which is 44.00% above the N10.19 billion posted at the end of the 2018 financial year.
• Profit after Tax, therefore, stood at N10.30 billion, from N6.10 billion in the corresponding year. Please note that the difference between the two profit figures is the same as 68.87%.
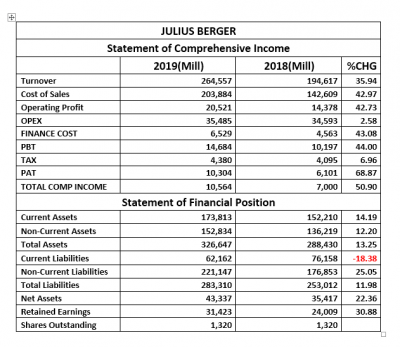
Statement of Financial Position
• Current Assets at the end of the 2019 financial year is valued at N173.81 billion, 14.19% above the N152.21 billion estimated in 2018.
• Non-Current Assets, on the other hand, is estimated at N152.83 billion versus N136.21 billion in 2018. Thus, Total Assets is valued at N326.64 billion as against N288.43 billion in the corresponding year.
• Conversely, Current Liabilities run through the year is estimated to worth N62.16 billion, down for the previously estimated N76.15 billion.
• Non-Current Liabilities stood at N221.14 billion, same as 25.05% above the N176.85 billion in the similar year. Thus, Total Liabilities is valued at N283.31 billion as against N253.01 billion in the prior year.
• Net Assets is estimated at N43.33 billion, the same as 23.36% above the previous estimate of N35.41 billion.
• Retained Earnings at the end of the year was worth N31.42 billion, 30.88% above the N24.00 billion stated in its 2018 financials.
Financial Strength
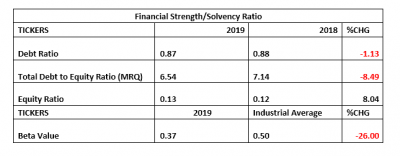
• Total Liabilities is the same as 87% of the Total Assets value for the year. In other words, the Debt Ratio is 0.87x, which is 1.13% below the 0.88x in the corresponding year.
• Total Debt to Equity Ratio is currently estimated at 6.54x, compared to 7.14x in the corresponding year, which implies that the Total Debt Value for the year can replicate Equity 6.54 times, as against the 7.14 times of the previous year.
• Equity Ratio is also valued at 0.13x versus 0.12x, which means Equity is the same as 13% of the Total Assets Value for the year.
• Going by the current estimated beta value, the shares of Julius Berger can be said to be less liquid as its beta value currently stands far below the market beta.
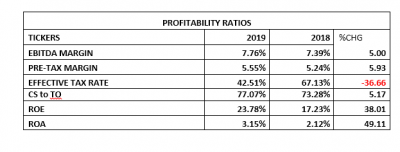
Profitability Ratio
• EBITDA Margin is currently estimated at 7.76%, versus a 7.39% estimate at the end of the 2018 financial year.
• Pre-Tax Margin stood at 5.55% as against 5.24% in 2018.
• Cost of Sales is estimated at 77.07% of the Turnover Figure, 5.17% higher than the 73.28% in the corresponding year.
Efficiency Ratio
• Operating Expenses is estimated at 13.41% of the Turnover Value, an appreciable improvement in the management efficiency when compared to the 17.78% estimated in 2018.
• Turnover is 80.99% of the Total Assets Value, while the ratio is 20.03% above the 67.47% estimated from 2018 figures.
• At 2.37x Working Capital Turnover dipped by 7.40% from the previously estimated 2.56x.
• Working Capital Ratio, within the two years, compared stood above unity and confirmed the firm’s strength to settle its current liabilities with current assets as at when due through the season.

Investment Ratios
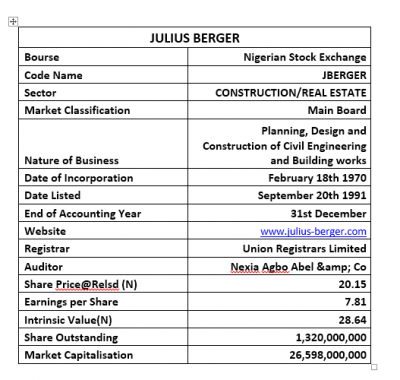
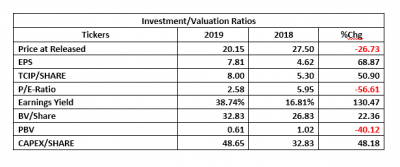
• Within the two periods compared, traders were seen largely revaluing the share price of Julius Berger on the floor of the exchange, following which it now stands at N20.15 (at release date), from N27.50 in the corresponding year.
• The estimated Earnings Per Shares of Julius Berger is N7.81, which is significantly higher than the N4.62 earned at the end of 2018.
• PE-Ratio is currently estimated at 2.58x, compared to the previous 5.95x.
• At the price of Julius Berger when the result was released, investors had a positive yield of 38.75%, as against 16.81% in the previous year-end.
• The Book Value of Julius Berger is currently estimated at N32.83, higher than the N26.83 estimated from the corresponding results.
• Confirming its undervalued nature on the floor of the exchange is the Price to Book Value ratio at below unity as shown in the below table.
Valuation
• Although Julius Berger’s performance is outstanding, we are of the opinion that its business is seasonal. Our valuation models are also based on a careful projection by our analysts. Using the current earnings as a guide, we have valued each unit of Julius Berger at N28.64, for possible upward projection at the release of its half-year 2020 financial numbers.


