Post Views:
1,125
Company: FIDSON HEALTHCARE PLC (FIDSON)
Rating: Hold
Market Price at Earnings Release: 5.70
Intrinsic Value: N6.00
Latest Cash Div: N0.20
By: Jeariogbe Tunde Segun (Equity Analyst)
Key Financial Tickers
- This report observed both the full year financial performance indices of Fidson Healthcare Plc for the year ended December 2017 and the first quarter 2018 statistics
- As at the end of the 2017 activities year, one individual and three corporate institutions owned above 5% of the company’s shares, they are:
- Fidelis Ayebae (29.77%)
- Glorious Haven Ltd (on behalf of Fidelis Ayebae) (5.74%)
- Stanbic Nominee (9.73%)
- CSP Nominee (12.16)
- Finance cost was observed to have increased in the current year by 45% as against last year. The figure currently reported was N1.001 billion as against the N690.776 million for 2016
- The increase in Finance cost was despite the reduced Interest bearing loans and borrowings of N2.992 billion, as against N3.514 billion reported in prior financial year.
- As at the end of 2017, the company reported non interest bearing loans and borrowings of N1.246 billion, down from N2.231 billion in 2016, and
- Interest bearing loans and borrowings of N1.746 billion as against N1.283 billion in the previous year.

Corporate Figures
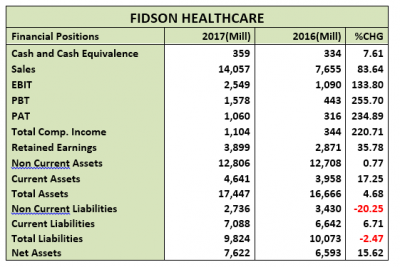
- At the end of the 2017 also, the management of Fidson Healthcare outran its last turnover figure by an outstanding 83.64% to N14.057 billion from the N7.655 billion posted at the end of 2016.
- As noted above, Finance Cost ballooned during the year, while Finance income dropped marginally against the previous financial year’s.
- Similarly, Selling and Distribution Expenses grew above 100% over the amount spent through the 2016 financial year. Selling and distribution expenses stood at N2.348 billion, as against N973.574 million in 2016.
- Operating Profit could therefore only rise to N2.549 billion compared to the N1.09 billion reported in 2016.
- Profit before Tax soared above prior year’s N443 million to 1.578 billion.
- Profit after Tax equally jumped up by 234.89%, to N1.060 billion from N316 million earned in the prior year.
- Retained Earnings improved to N3.899 billion as against the N2.871 reported in 2016
- Non Current Assets improved marginally over comparable year by 0.77% to N12.806 billion, from N12.708 billion.
- Meanwhile, Current Assets climbed by 17.25% to N4.641 billion, compared to N3.958 billion.
- Positively, Total Liabilities dropped marginally by 2.47% to N9.824 billion, which was better than the previous N10.073 billion.
- Net Assets therefore grew by 15.62% at N7.622 billion from N6.593 billion reported in the last financial year.

Corporate Figures
- At the end of the 2017 also, the management of Fidson Healthcare outran its last turnover figure by an outstanding 83.64% to N14.057 billion from the N7.655 billion posted at the end of 2016.
- As noted above, Finance Cost ballooned during the year, while Finance income dropped marginally against the previous financial year’s.
- Similarly, Selling and Distribution Expenses grew above 100% over the amount spent through the 2016 financial year. Selling and distribution expenses stood at N2.348 billion, as against N973.574 million in 2016.
- Operating Profit could therefore only rise to N2.549 billion compared to the N1.090 billion reported in 2016.
- Profit before Tax soared above prior year’s N443 million to 1.578 billion.
- Profit after Tax equally jumped up by 234.89%, to N1.060 billion from N316 million earned in the prior year.
- Retained Earnings improved to N3.899 billion as against the N2.871 reported in 2016
- Non Current Assets improved marginally over comparable year by 0.77% to N12.806 billion, from N12.708 billion.
- Meanwhile, Current Assets climbed by 17.25% to N4.641 billion, compared to N3.958 billion.
- Positively, Total Liabilities dropped marginally by 2.47% to N9.824 billion, which was better than the previous N10.073 billion.
- Net Assets therefore grew by 15.62% at N7.622 billion from N6.593 billion reported in the last financial year.

Profitability Ratios
- Cost of Sales margin is currently estimated at 49.10% slightly above the 47.02% estimate of last year.
- Profit before Tax margin is same as 11.23% and fairly double the estimate of 2016
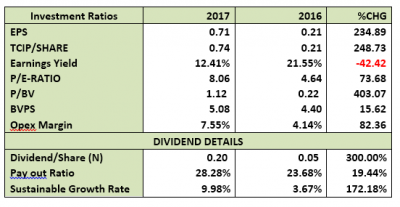
- Similarly, Profit after Tax grew by 82.36% over comparable year of 2016. The ratio shifted to 7.55% as against previous estimate of 4.14%
- Return on Average equity is currently estimated at 13.92%, compared to the 4.80% estimated in 2016.
- Return achieved on Average Assets is now 6.08% against the previous 1.90%.

Efficiency Ratios
- Testing the management’s efficiency, when Asset Turnover ratio was gauged, there was a 75.42% improvement, from 45.93% to 80.57% within the review, period.
- Also tested was the Equity Turnover, which stood at 184.41%, as against the 116.10% estimated in 2016.
- In other words, the equity was multiplied 2.29x through the 2017 financial activities year, which was below the 2.53x in 2016.
- Loan to Deposit ratio remained high as the ratio improved by 9.45% over 2016 estimate. Estimated Loan to Deposit ratio for the current year is 99.16% against 90.60%
- See below for further efficiency ratios

Investment Ratios
- Following same trend as in the earnings the amount earned per unit of Fidson Healthcare share (EPS) improved outstandingly by 234.89% from N0.21 to N0.71, an almost tripple position
- Due to the large difference in market price between the two financial years compared in this analysis, the current earnings yield stood below estimated yield in the previous year. As shown in the table below, the current yield is 12.41% as against 21.55%
- Price Earnings ratio (PE/Ratio) marginally confirmed investors’ preference for Fidson Healthcare’s shares as it moved from 4.64x to 8.06x.
- Two ratios confirming an overpriced position of each share of Fidson on the floor of the Exchange are the Price to Book Value (P/BV) and the Book Value (BV). Since P/BV stood above 1, it implies that each unit is theoretically overpriced. Confirming this further is the estimated BV of N5.08 as against the market price of N5.70 (as at the release date of the 2017 full year result).

First Quarter 2018 Financial Indices
- The income statement improved over corresponding quarter of 2017:
- Turnover improved by 5.51% to N3.610bn against the ₦3.421bn posted in Q1 2017,
- Profit before Tax improved over the 2017 level by 25.98% from N236.728 million to N298.231 million
- Profit after Tax equally appreciated over that of 2017 by 25.98% at N202.797 million, compared to N160.975 million last year
- Total Assets grew by 7.94% from N16.472 billion to N17.781 billion.
- Total Liabilities grew by 1.66% to N9.955 billion from N9.793 billion.
- Net Assets posted for the period is now N7.825 billion, which is 17.16% below the previous N6.679 billion.
- On the strength of the above:
- Profit per share for the period is estimated at 14k, compared to the 11k earned in Q1-2017
- The said earnings is a yield of 2.48% over the current market price, as at the release of the financials.
- Book Value increased to N5.22 above the N4.45 achieved at the end of Q1-2017
Valuation
- Our blend of valuation models do not agree fully with the overpriced state of Fidson Healthcare’s share price as established by the Book Value and the Price to Book Value estimated from the full year 2017 financial performance of Fidson. We have valued each unit of Fidson’s share price for N6.00.


