Company: FLOUR MILLS NIG. PLC (FLOURMILL)
Rating: Buy
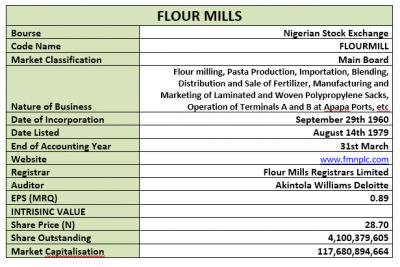
Market Price at Earnings Release: N28.70
Intrinsic Value: N40.00
Latest Cash Div: N1.00
By: Jeariogbe Tunde Segun (Equity Analyst)
Key Financial Tickers
• This report observed the financials of Flour Mills Nigerian Plc, for the first three months ended June 30, 2018. Meanwhile, full year indices were utilized in arriving at the intrinsic value for each unit of its shares.
• Please note the reduced dividend of N1.00 in its last full-year financial performance as against the previous year’s N2.62, resulted mainly from the increased share outstanding (now 1.467 billion ordinary shares of 50k each), due to the recently concluded rights issue. Recall that the right offer price was N27.00 per share.
• Nevertheless, we identified that the performance indices for the first quarter under review stood below that of the corresponding period of 2017.
Four Mills Nigeria’s Strength
• The major revenue drivers for Flour Mills are its investments to raise capacity in the different business segments of operation. Most significant is the commissioning of a 750,000MT sugar refinery in Lagos to increase its operating capacity from 24% at the end of FY’14. The plant is currently operating at about 50% capacity by producing 375,000MT.
• We expect revenue from the sugar refinery to grow at a much lower compound rate of 2.6% annually till 2019.
• Also, the increase in its flour milling capacity will contribute significantly to revenue growth in the ‘other foods’ segment (food businesses, apart from Golden Sugar) over the next few years from when the company launched its products in the snacks, powdered drinks and breakfast cereals segment of the market.
• We estimate that the ‘other food’ segments will grow up to 3.5% YoY till 2019 as Nigeria’s population and middle income earners increase, giving the ongoing aggressive efforts by the labour union to increase Nigeria’s minimum wage.

Corporate Figures
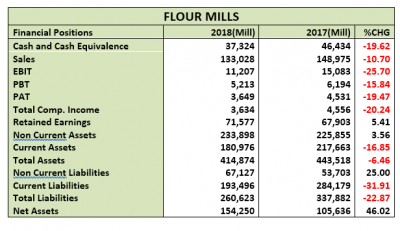
• Total Turnover (TO) reported for the first three months of 2018 is 10.70% below the corresponding quarter of 2017, as N133.02 billion was reported for the period, as against the N148.97 billion of Q1-2017
• Despite the reduced TO, Selling and Distribution Expenses increased to N2.02 billion, compared to N1.25 billion in similar period of 2017.
• Similarly, Administrative Expenses for the period at N4.68 billion was higher than the N4.05 billion of Q1-2017.
• Thus, Operating Profit stemmed below the 2017 figure. A total of N15.083 billion was estimated through the first three months of 2017 compared to the current N11.207 billion
• Profit before Tax slipped to N5.213 billion, as against to the N6.194 billion reported for same period in 2017.
• Having considering Tax Expenses for the period, N3.649 was reported as the Profit for the period, this is 19.47% below corresponding quarter’s profit of N4.531 billion.
• Due to the loss on available for sale investment, the Total Comprehensive income for the period was estimated at N3.634 billion, as against N4.556 billion in Q1-2017.
• Retained earnings improved over the period to N71.577 billion from N67.903 billion in prior year.
• Non Current Assets increased marginally, by 3.56% from N225.85 billion to N233.89 billion. This confirmed marginal capital investment within the observed periods
• Meanwhile, Current Assets dipped by 16.85%, having moved to N180.97 billion from N217.66 billion reported in the previous first quarter financial.
• Non Current Liabilities increased within the period to N67.12 billion, compared to the N284.17 billion in 2017 first quarter.
• Kindly observe that all items under the Non Current Liabilities in the first three months of 2017 stood below what was reported in the current first quarter financial.
• Enhanced by reduction in Bank Overdraft and Borrowings in the current first quarter financial compared to Q1-2017, the Current Liabilities stood at 31.91% below that of the previous quarter. See below table for details
• Since Assets and liabilities change rate favored the current quarter more, Net Assets for the current period is 46.02% above that of 2017. See below for details.

Liquidity/Risk Ratios
• Equity Holder may be suffering the impact of the nation’s economic challenges on Flour Mills, given that Total Debt by Four Mills is same as 97.93% of the total Equity. This is despite the fresh rights issue. Please note that the estimated industrial Average is 18.72%
• Current Ratio stood slightly below unity implying little challenges may be faced in settling current liabilities as at when due.
• Fairly above others in the industry, beta value of 0.97 as against 0.91 industrial average indicate lower volatility than the market
• Although far below the industrial average of 9.09x Flour Mills still have enough strength of servicing its interest yielding liabilities as at when due. Please note that it is strictly advised that, unless the company improved its financial strength, assessing interest yielding liabilities should be avoided.

Profitability Ratios
• Cost of Sales margin is currently estimated at 87.02% slightly below the 88.43% estimated last year.
• Profit before Tax margin is 3.92% also below the 4.16% margin estimated from the corresponding quarter figures
• Similarly, Profit after Tax margin stood below that of Q1-2017. We have currently estimated N2.74% as against the previous N3.04%
• Return on Average equity is currently estimated at N2.37% far below the 4.29% achieved in similar period of 2017
• Return achieved on Average Assets now 0.88% as against 1.02%
• This confirmed a lower profitability rating by the management of Flour Mills Plc. We are of the opinion that this shows the true economic state of higher running expenses and tight business terrain in the country, further impacting the unfavorable business environment are various insurgent in various part of the country, especially in the northern part of the country and oil exploration state.

Efficiency Ratios
• Testing the management efficiency, the Asset Turnover was gauged, the Ratio declined by marginal 4.54% from 33.59% to 32.06%.
• Also tested was the Equity Turnover, whichcurrently stood at 86.24% as against the 141.03% estimated in 2017. Please note that the newly raised capital through right issue further impacted the drop
• In other words, the equity was multiplied 2.69 times through the first three months of 2018 financial activities, far below the 4.20 times in Q1-2017.
• It was also estimated that Fixed Assets turnover is same as 56.87% below the 65.96% estimated in Q1-2017

Investment Ratios
• Following same trend as in the earnings the amount earned per unit of Flour Mills Plc in its Q1- financial performance,Earnings per Share (EPS)dropped by 48.46% against the comparable period of 2017. The current EPS estimate is N0.89
• Similarly, Total Comprehensive Income for the period is same as EPS since difference between the two figures is minimal. See the below table for details
• Price Earnings Ratio (PE/Ratio) is currently estimated at 8.06x as against the previous 4.05x. Although this is mainly used in confirming investment recouping time, it is also indicating investors’ sentiments on the price of Flour Mills; going by the reduction observed, it implies negative sentiments
• Two ratios confirming an overpriced position of each share of Flour Millsshare price on the floor of the Exchange are the Price to Book Value (P/BV) and the Book Value (BV). Since P/BV stood below one (1) it implies that the share unit is theoretically underpriced. Confirming this further is the estimated BV of N37.62 as against the market price of N28.70 (as at the released of the current full year result) and the current market price of N20.40 (10/10/18).

Valuation
• Our weighted average DCF and P/E valuation for Flour Mills Nigeria gives TP of N45.00 (which implies a 56.79% upside potential from current price of N120.58. We therefore maintain a BUY recommendation on FLOURMILL.


